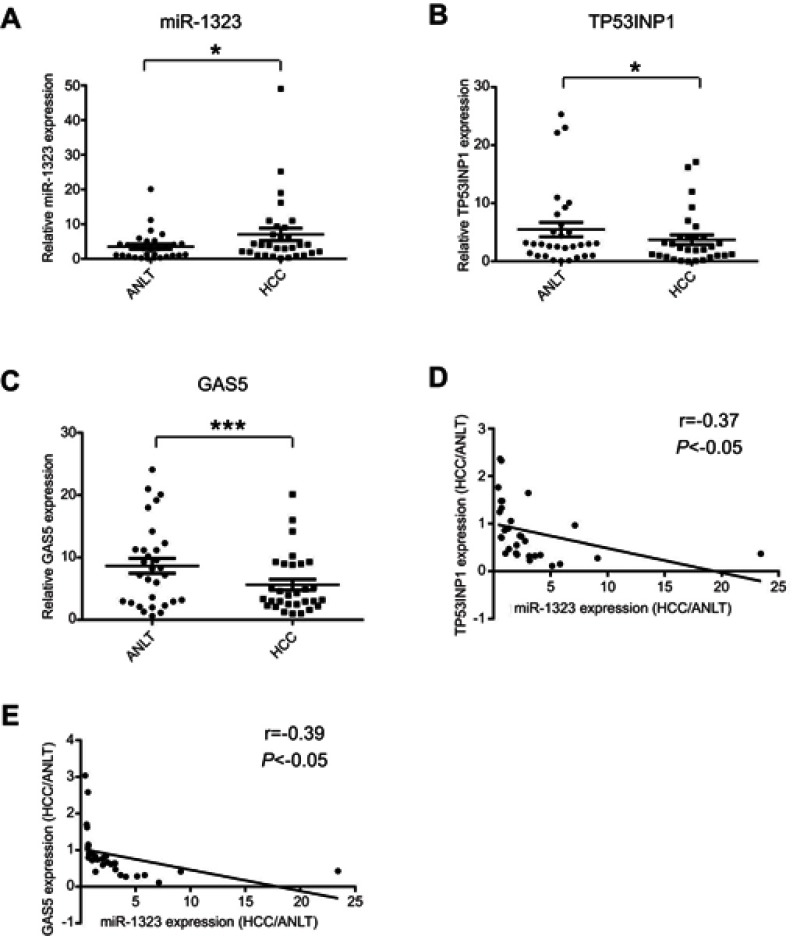
Figure 5.
Expression levels of miR-1323, TP53INP1 and GAS5 in HCC tissues. (A–C) Expression levels of miR-1323, TP53INP1 and GAS5 in 30 pairs of tumor tissues and ANLTs from patients with HCC were determined by qRT-PCR. (D) The correlation between miR-1323 and TP53INP1 expression in tumor tissues of patients with HCC was analyzed (n=30). (E) The correlation between miR-1323 and GAS5 expression in tumor tissues of patients with HCC was analyzed (n=30). *P<0.05, ***P<0.001.

