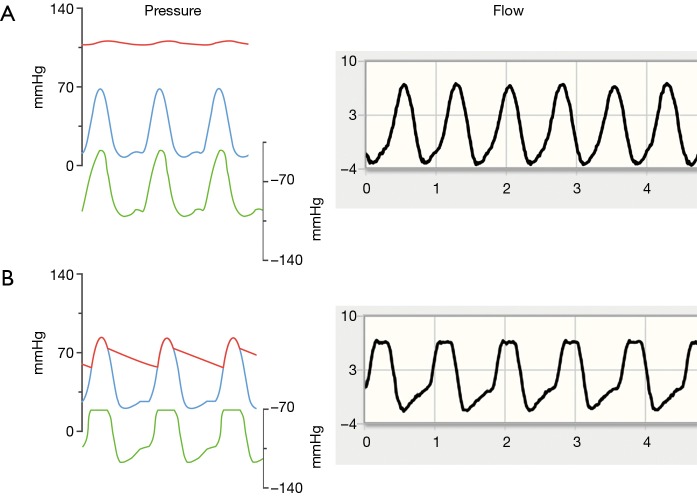
Figure 1.
Representative wave forms of myocardial contractility and aortic valve opening. Left: pressure waveforms for the ascending aorta (red), left ventricle (blue) and difference left ventricle—aorta (green; negative values, scale offset). Right: representative flow waveforms from the telemonitoring system. (A) Aortic valve not opening; (B) aortic valve opening. Pressure curves (on the left) modified from Burkhoff et al. (13) with permission.

