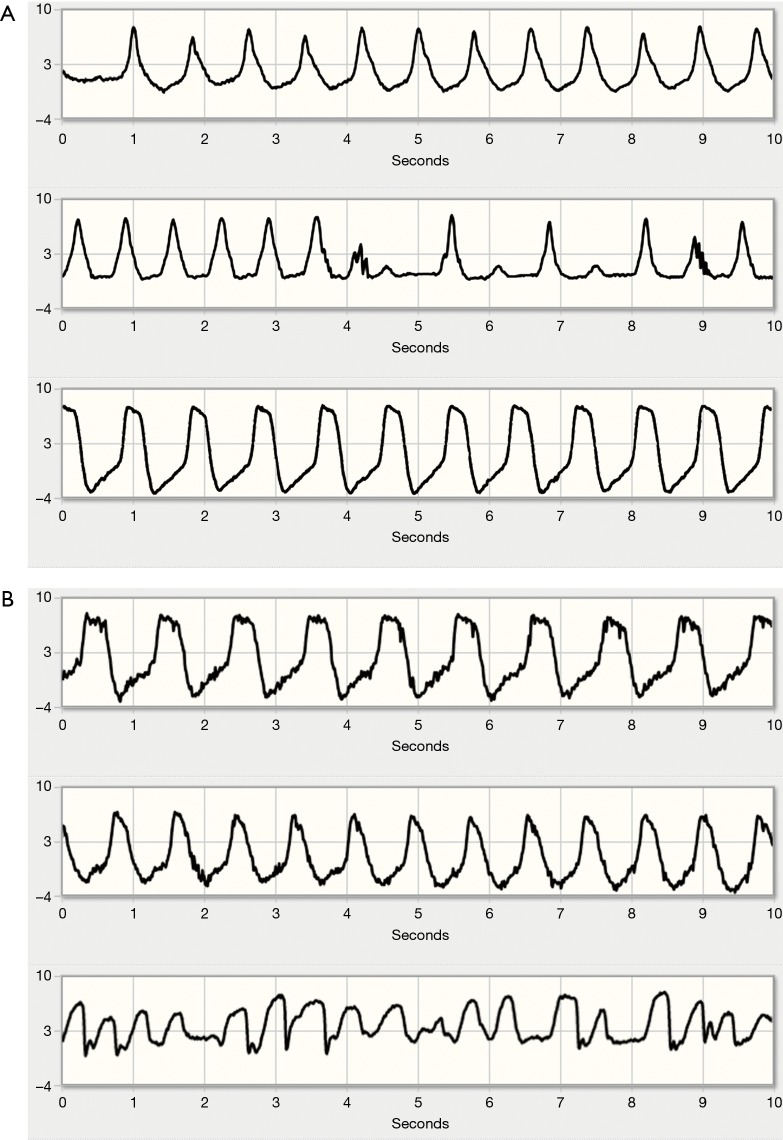
Figure 2.
Representative waveforms of hypovolemia. (A) Hypovolemic episode in the telemonitoring system. Top: typical hypovolemic flow waveform. Note the fast undulations in flow; Centre: additional mild suction artefacts at 4 and 9 seconds and significant beat-to-beat variation in flow, suggesting severe hypovolemia; Bottom: normalization of the flow waveform after sufficient fluid intake. (B) Hypovolemia with suction events, as represented in the telemonitoring system. Top: baseline flow waveform; Centre: hypovolemic flow waveform; Bottom: suction event with sudden, steep decreases in flow.

