
Figure 3.
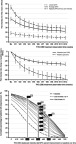
Change of the lowest, average and highest 24-hour pain intensities (mean ±95% CIs) during the 12-week treatment observation with THC:CBD (upper panel). Absolute and relative relief of the 24-hour pain intensity index (PIX) over the 12-week observation time (middle). Percentage of patients with ≥30%, ≥50%, and ≥70% percent improvement of the pain intensity index (PIX) over time (lower panel).
Abbreviations: BL, baseline; W1-W12, weeks 1–12; THC, Δ9-tetrahydrocannabinol; CBD, cannabidiol; PIX, pain intensity index.