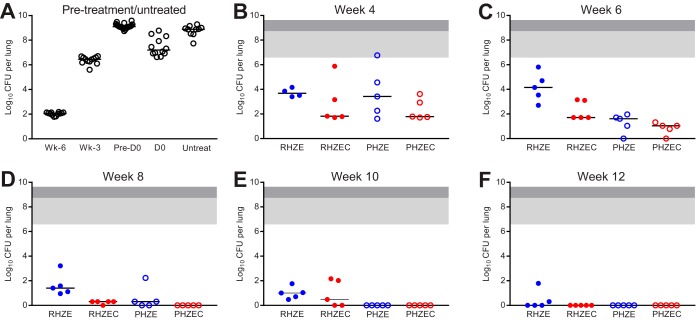
FIG 2.
Lung CFU counts of C3HeB/FeJ mice before and during treatment. Lung CFU counts from mice sacrificed the day after infection (“Wk-6”), 3 weeks after infection (“Wk-3”), and on the day of treatment initiation (“D0”) are shown in panel A, as are the lung CFU counts for mice that became moribund and were euthanized after Wk-3 but before D0 (“Pre-D0”) and for the untreated negative-control mice (“Untreat”). Lung CFU counts after 4, 6, 8, 10, and 12 weeks of treatment are shown in panels B, C, D, E, and F, respectively. Treatment regimens are described in Table 1. Due to the variability associated with this model, the lung CFU counts were plotted by individual mouse, with the median value indicated with a black bar. For panels B to F, the area shaded light gray indicates the range of lung CFU counts at the start of treatment in the mice sacrificed at D0, and the area shaded dark gray extends the range to include the lung CFU counts of the mice that died prior to D0. Raw CFU data are presented in Table S2 (Wk-6), Table S13 (Wk-3, D0), Table S14 (Pre-D0, Untreated), and Tables S15, S16, S17, S18, and S19 (week 4, 6, 8, 10, and 12, respectively).

