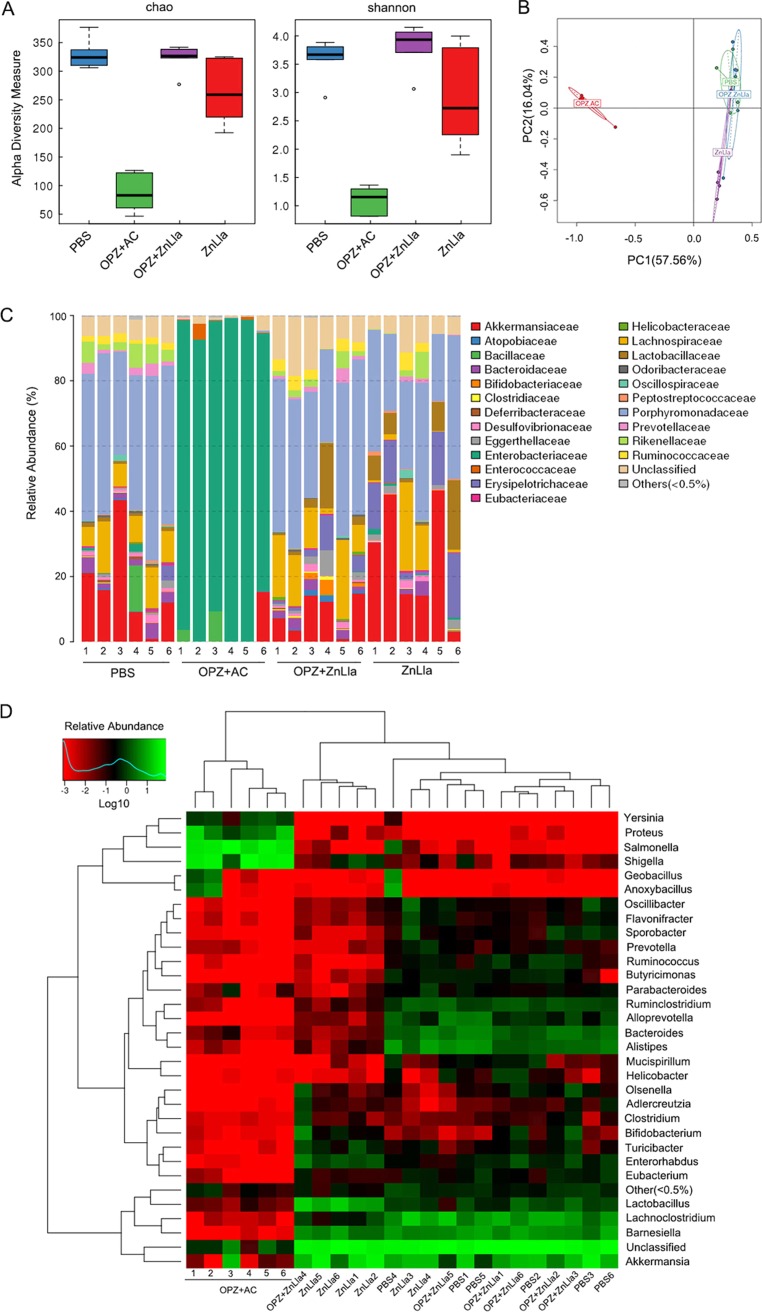
FIG 6.
ZnLla causes minimal alterations in the diversity and composition of the gut microbiota. (A) Alpha-diversity estimates calculated from the sequenced data using Chao1 (left) and Shannon (right) indices for the four groups treated with PBS, triple therapy (OPZ+AC), omeprazole and ZnLla (OPZ+ZnLla), and ZnLla, respectively. The five lines, from bottom to top, are the minimum value, the first quartile, median, third quartile, and maximum values, and the abnormal value is shown as “o.” Statistical significance was calculated between the corresponding time points of the two groups. (B) PCA of the four groups based on OTU abundance. The number in brackets represents the contributions of principal components to differences among samples. A dot represents each sample. (C) Relative abundances of bacterial families in each sample receiving different treatments identified from the sequenced data. Data are clustered according to sample number of each group along the x axis. (D) Heat map comparing average abundances of species-level classification of the 16S rRNA gene sequences from each sample receiving different treatments.

