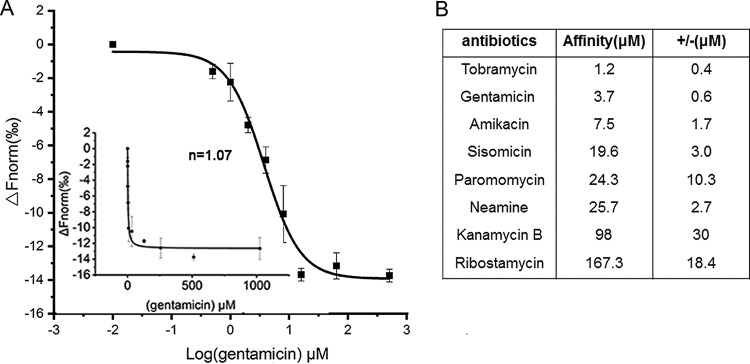
FIG 3.
(A) Microscale thermophoresis (MST) binding curve for the aac-6 leader riboswitch RNA with gentamicin. Inset shows the Hill plot and Hill coefficient (n) for gentamicin binding. Error bars are standard deviations of the results from at least three independent experiments. (B) Binding affinities (in micromolar) of the aminoglycoside antibiotics for the aac-6 riboswitch RNA. Error bars are standard deviations of the results from at least three independent experiments.

