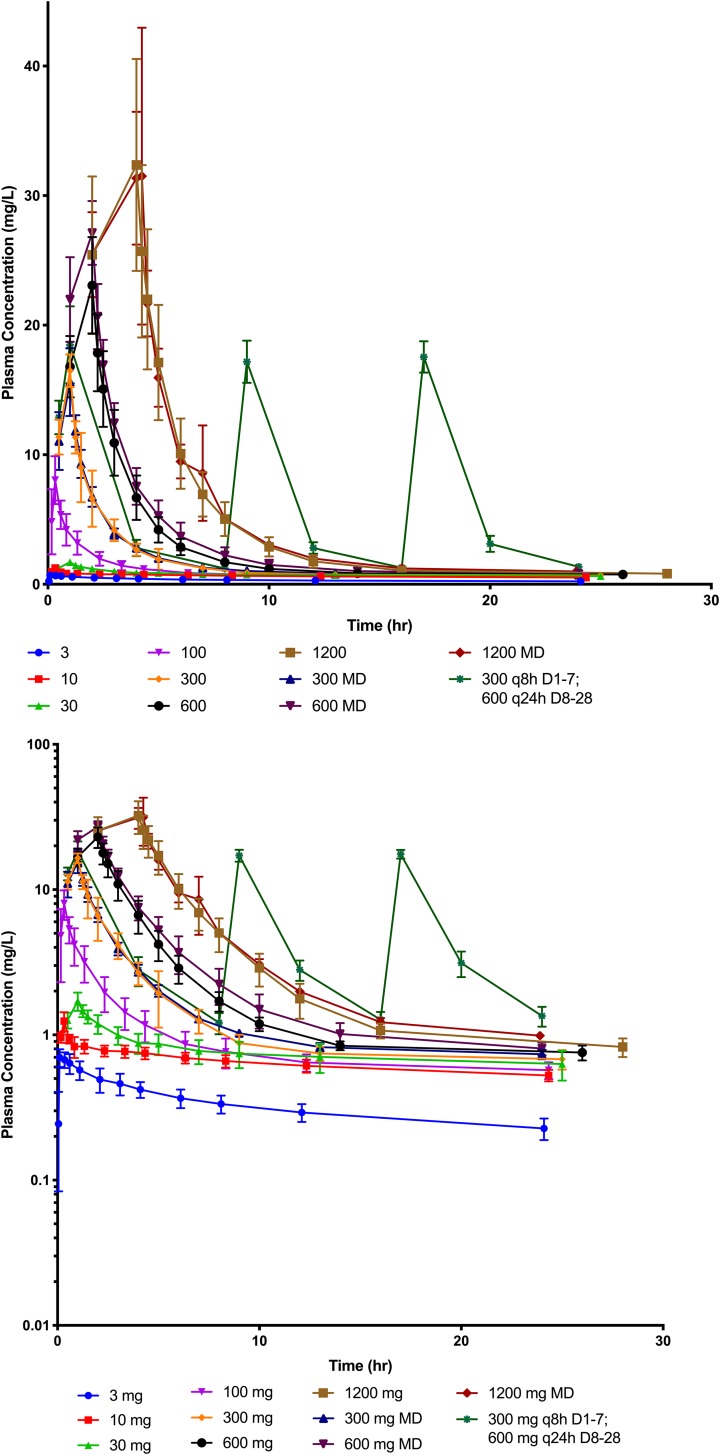
FIG 2.
VL-2397 plasma concentration versus time over the first 24 h after dosing for all cohorts on a linear (upper) and semilogarithmic (lower) scale. Mean values (±standard deviations [SD]) for each time point at each dosage level are represented by the symbols and bars above and below each symbol. Milligram doses are represented in the graph. MD, multiple dose; TID, dosing three times a day; QD, once-daily dosing.

