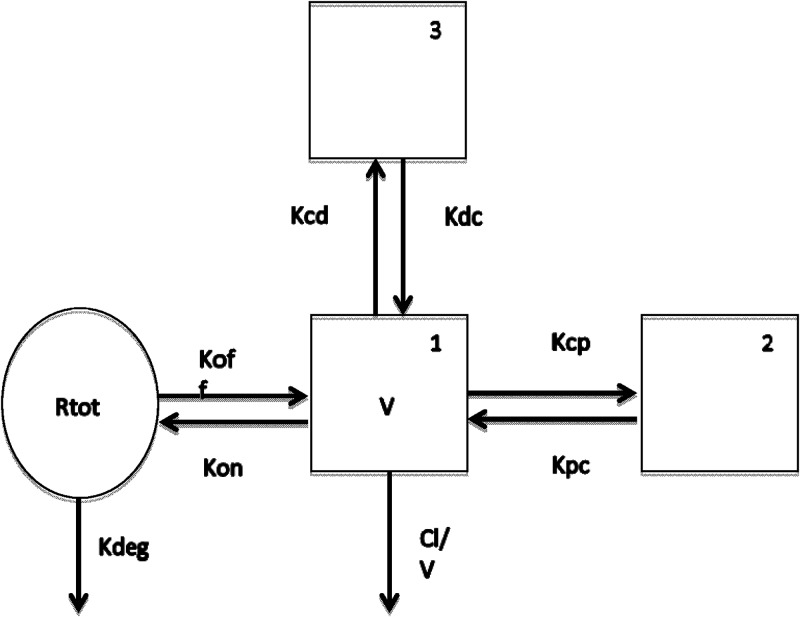
FIG 4.
Illustration of structural PPK nonlinear saturable binding model. Structural illustration of the population PK model. Boxes represent the plasma compartments (1 is central, 2 and 3 are peripheral). The circle represents the binding compartment. Arrows demonstrate the flow of drug through the compartments and elimination. Abbreviations: CL, clearance; V, volume in the central compartment; Kcp, Kcp, Kpc, Kcf, and Kfc, rate constants for drug moving from the different compartments (c, central; p, peripheral; f, third compartment); Kon and Koff, rate constants of association and dissociation; Rtot, maximum binding; Kdeg, rate constant regulating clearance from the binding compartment.

