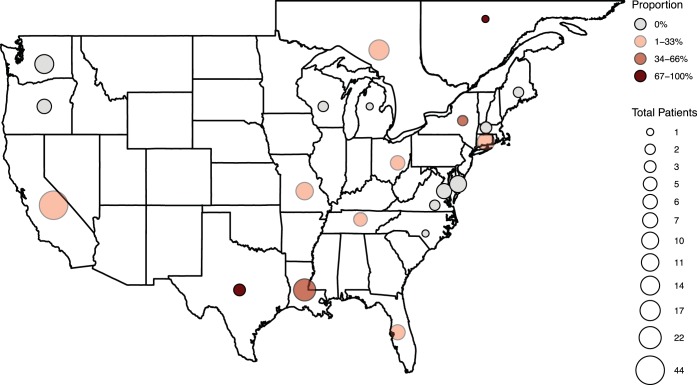
FIG 7.
Geographic distribution of patients enrolled with the proportion of qacA4-carrying isolates within each geographic location. The size of the circles represents the total number of patients enrolled in each state or province, and the shade of the circle represents the proportion of the total patients with at least one qacA4-carrying S. epidermidis isolate.

