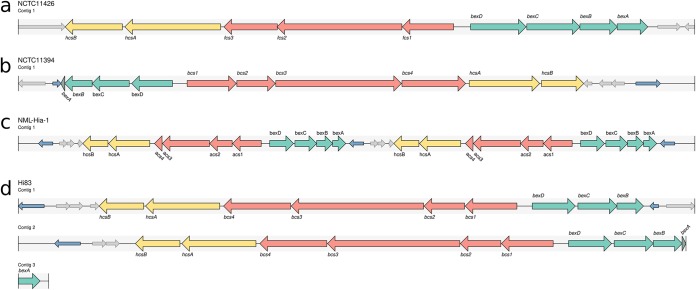
FIG 3.
Examples of hicap visualization for selected genomes. cap locus genes are annotated as large arrows with the direction representing the strand. Genes of the cap locus are colored to indicate region (region I, green; region II, red; region III, yellow). A truncated cap gene is given a darker shade of color for the respective region. Copies of IS1016 are denoted as small blue arrows, and open reading frames that do not generally belong to the cap locus are show as small gray arrows. (a) The complete and contiguous annotation of the NCTC 11426 cap-f locus. (b) The NCTC 11394 cap-b locus, which contains a truncated bexA gene and two copies of IS1016. (c) A duplication of the cap-a locus is observed in the assembly of NML-Hia-1. (d) The cap-b locus of Hi83 is also duplicated but is present across multiple contigs in the input assembly, as represented by multiple tracks.

