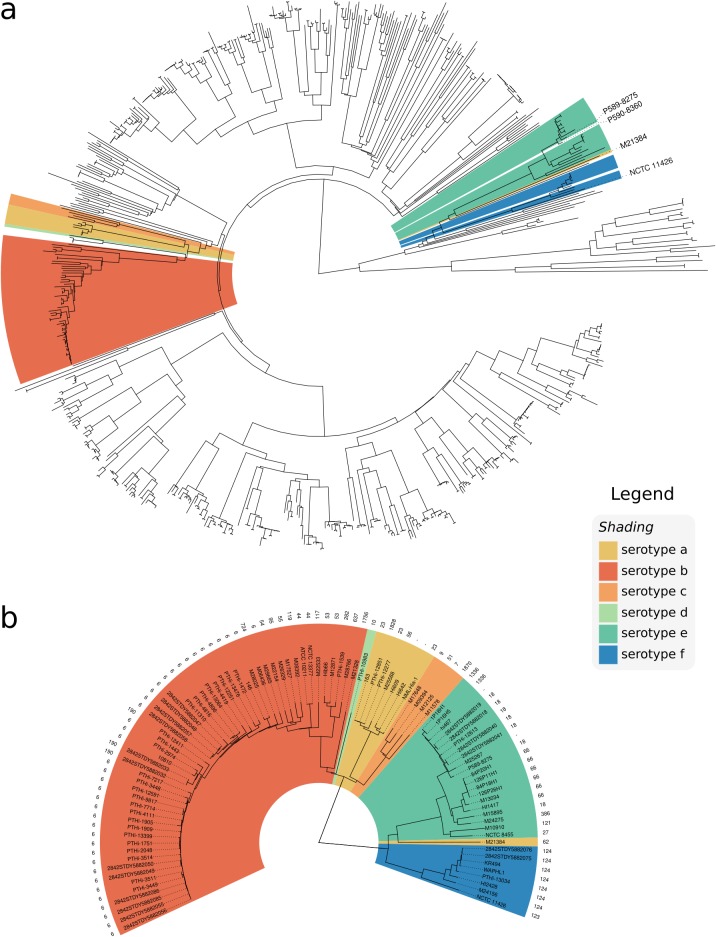
FIG 4.
Whole-genome neighbor-joining phylogeny inferred from MASH distances of assemblies in the GenBank data set. Isolates are annotated with the respective serotype as predicted by hicap. (a) Distribution of capsular serotypes in the complete data set. (b) The phylogeny subtree including only isolates that contained a cap locus, additionally annotated with the sequence type.

