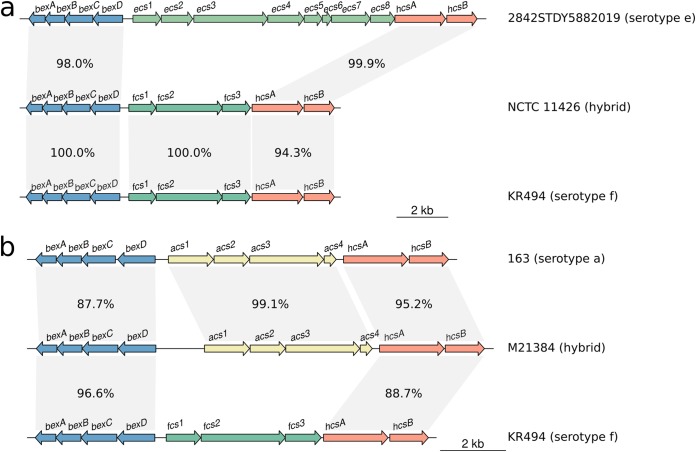
FIG 6.
Homology plots generated using R and genoPlotR, showing the cap loci of two isolates which appear to have been subject to recombination. Different regions of the NCTC 11426 (a) and M21384 (b) cap loci show varying homology to different reference cap loci, suggesting a recombinogenic ancestry.

