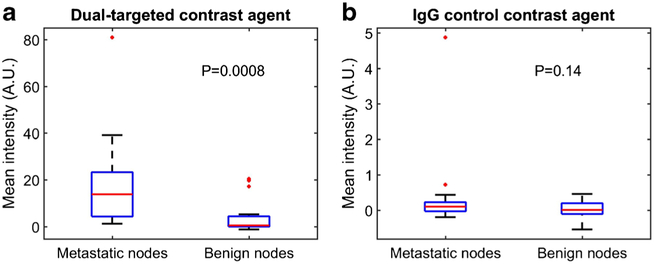
Fig. 3.
Comparison of the mean intensities from a dual-targeted and b IgG control contrast agents for metastatic and benign nodes (the central mark on each box is the median, the edges of the box are the 25th and 75th percentiles, the whiskers extended to approximately ±2.7 standard deviation, and outliers are plotted individually).

