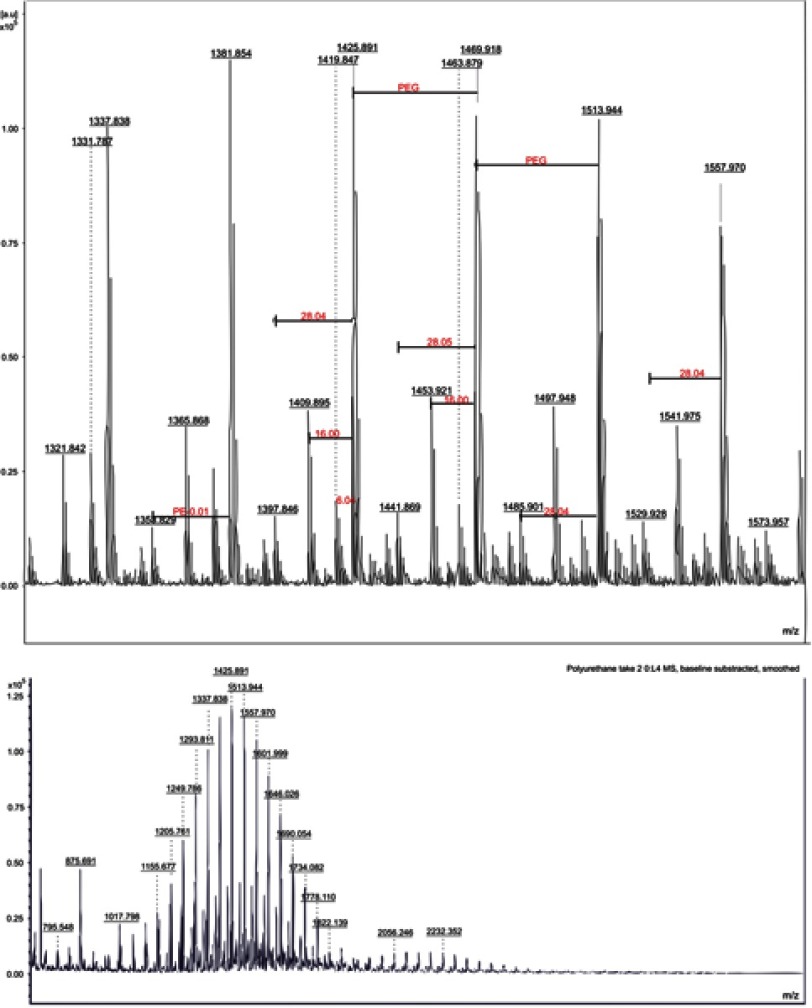
Figure 2.
MALDI-TOF spectra of polyurethane particles.
Notes: L4 represents the number of mass spectrometry analyses done on our polyurethane (PE) sample. PEG and PE represent polyethylene-glycol and PE fragments. Red color was used to highlight the fragments (28, mass of ethylene) whilst black numbers were used for the main m/z peaks. The top image is a detailed spectra (a part of the bottom one - around m/z =1420).
Abbreviation: MALDI-TOF, matrix-assisted laser desorption ionization time-of-flight mass spectrometry.

