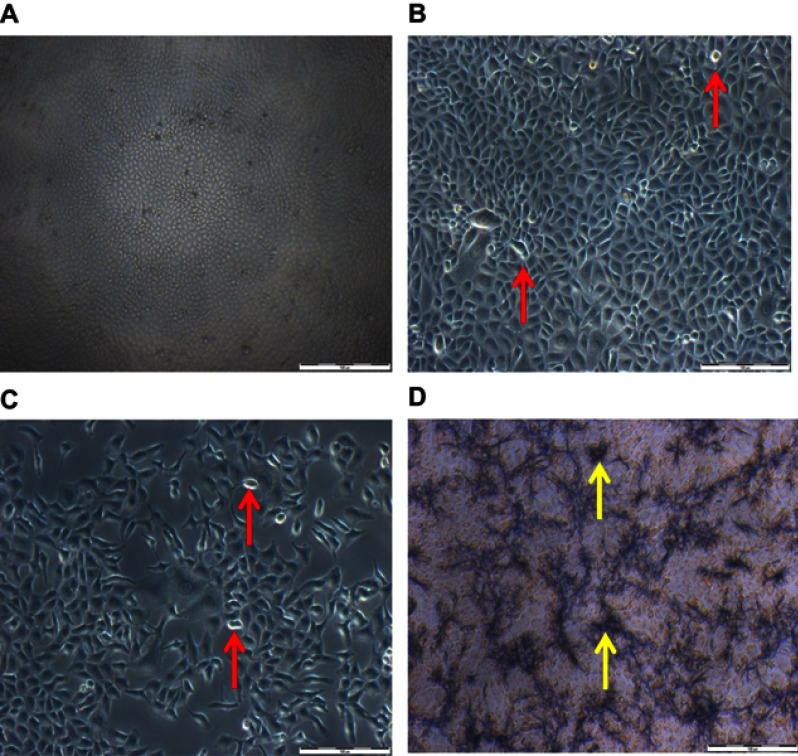
Figure 7.
Morphology of MCF-7 cells treated for 48 hrs with DOX as well as doxorubicin nanoparticles (DOX-NPs). (A) Control cells (untreated). (B) Cells treated with free NPs. (C) Cells treated with DOX. (D) Cells treated with DOX-NPs. Red indicators portray cell shrinkage with detachment; yellow arrows portray DOX-NPs coacervates (scale bar: 100 µm).

