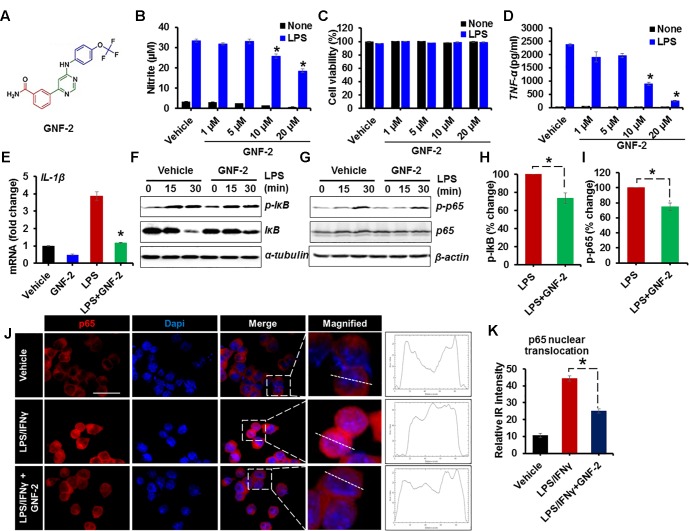
FIGURE 1.
GNF-2 inhibits LPS-induced inflammatory activation of microglia. (A) Chemical structure of GNF-2. (B) The dose-dependent effect of GNF-2 on BV-2 cells in either the presence or absence of LPS (100 ng/ml) stimulation. (C) The cytotoxicity was measured using the MTT assay 24 h after treatment with LPS and the indicated compound concentration. (D) TNF-α release was measured by ELISA in BV-2 cells treated with LPS and GNF-2 for 24 h. (E) Real-time PCR for IL-1β mRNA expression in BV-2 cells treated with LPS or GNF-2 (10 μM) for 24 h. (F,G) Western blot analysis for the phosphorylation of IκB (F) or NF-kB p65 (G) in BV-2 cells treated with LPS for 15 and 30 min following 1 h of GNF-2 (10 μM) pre-treatment. IκB degradation was measured by anti-IκB blotting. α-tubulin and β-actin were used as loading control. (H) Quantification for the relative % change in p-IkB at 30 min after LPS or GNF-2 treatment. (I) Quantification for the relative intensity for p-p65 western blot bands at 30 min after LPS or GNF-2 treatment. (J) Immunocytochemistry for p65 in BV-2 cells in either presence or absence of GNF-2 with LPS treatment. Fluorescence intensity profile for p65 across a transverse section of one cell is presented adjacent to the magnified images. The dotted line shows the cross section of the single cell for the fluorescence intensity profile. (K) Quantification for the relative IR intensity for the p65 nuclear translocation is presented in the adjacent graph. Nuclear translocation of p65 IF intensity was measured for 10 randomly selected cells from each group with ImageJ. Data are presented as mean ± SEM. ∗p < 0.05 vs. LPS from ANOVA and unpaired two-tailed Student’s t test; n = 3 for each group. Scale bar, 50 μm.

