Figure 1.

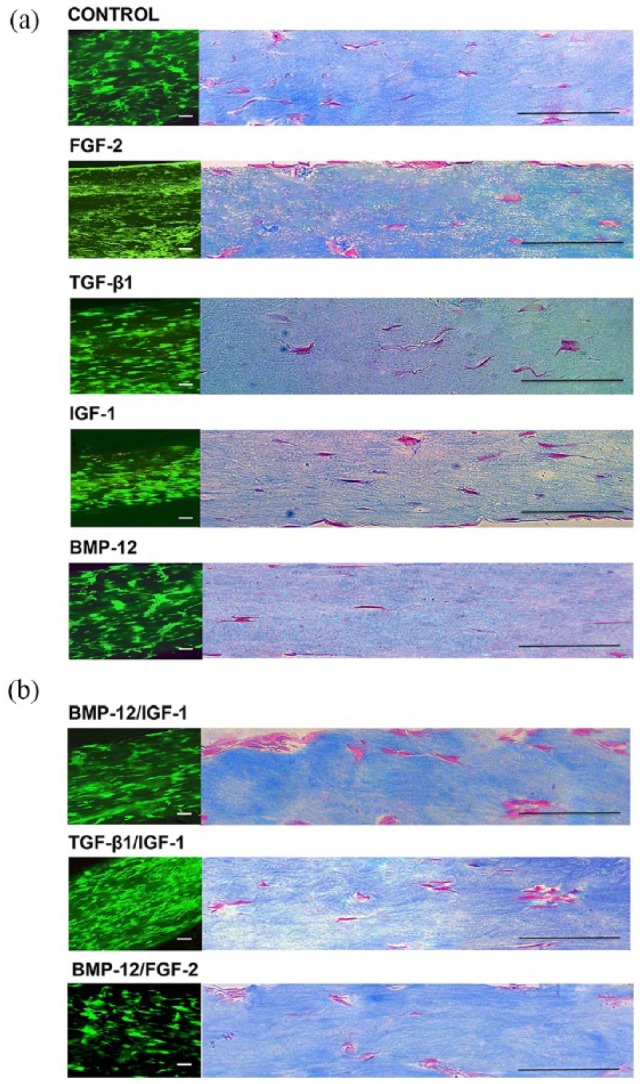
Fluorescence microscopy (a) and Masson’s trichrome histology images (b) of day-10 gels. All constructs exhibited uniform integration of MSCs in three dimensions. MSCs were highly aligned to the axis of tension. Scale bars represent 125 μm.

Fluorescence microscopy (a) and Masson’s trichrome histology images (b) of day-10 gels. All constructs exhibited uniform integration of MSCs in three dimensions. MSCs were highly aligned to the axis of tension. Scale bars represent 125 μm.