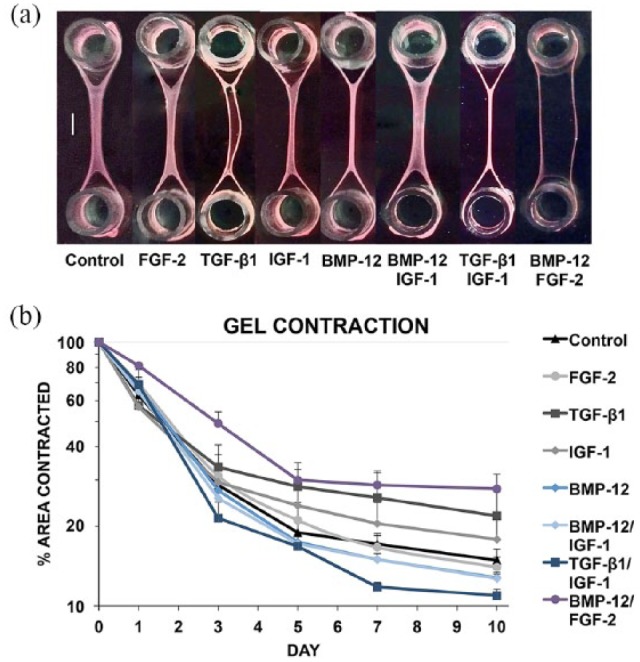
Figure 3.

Digital images of constructs at harvest (a) and graphical representation in logarithmic scale of percentage contraction of constructs over 10 days of culture (b). Within group, comparisons showed that each group had contracted gel area from the previous time point. BMP12/FGF2 constructs had contracted the least at culture endpoint, and TGF-β1/IGF-1 constructs had contracted the most. Scale bar on images represents 5000 µm.
