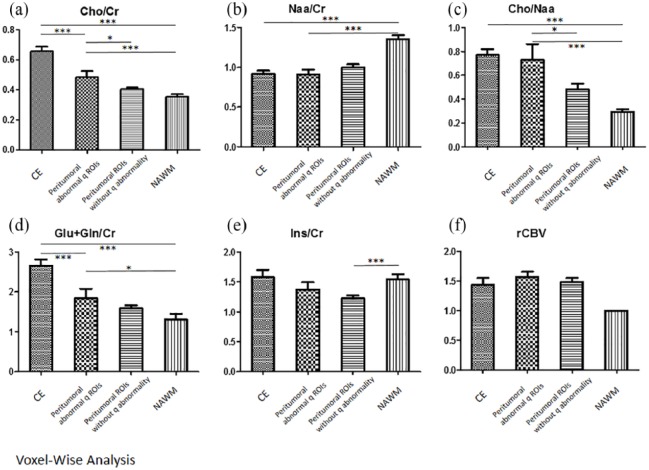
Figure 3.
MRS and perfusion characteristics between different ROIs.
The MRS data of different chemical compounds (a–e) and rCBV (f) between different regions of interest (ROIs) are shown. The contrast-enhanced ROI (CE), peritumoral abnormal q ROIs and the peritumoral ROIs without q abnormality, and the control contralateral normal-appearing white matter (NAWM) are demonstrated.
*p < 0.05.
**p < 0.01.
***p < 0.001.

