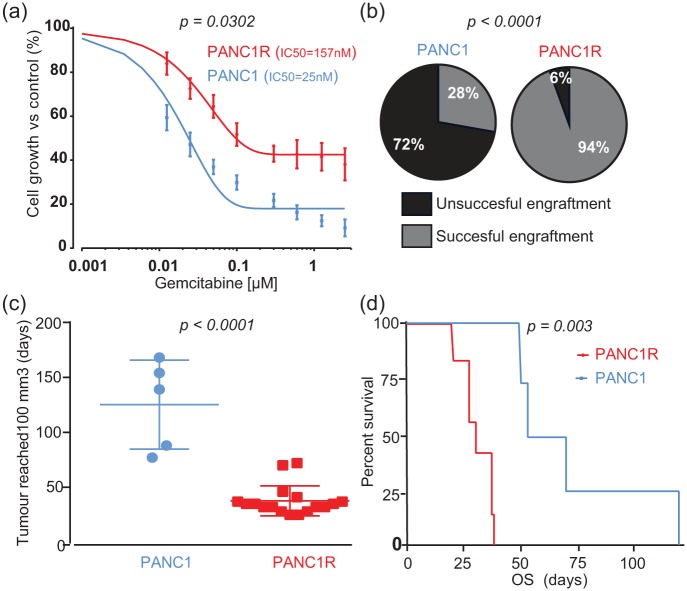
Figure 1.
Characterization of sensitive PANC1 and resistant PANC1R cells in vitro and in vivo.
(a) Dose-response curves of PANC1 (blue) and PANC1R (red) cells display a reduced sensitivity to gemcitabine. Points and bars, mean values and SEM obtained from 10 independent experiments. (b) PANC1R cells induce significantly more tumours by subcutaneous engraftment (n = 36, 18 mice per arm) than PANC1 cells. (c) Tumours originating from PANC1R developed an evident tumour nodule faster. (d) Tumours of PANC1R origin resulted in poorer OS (Day 0 was set for each mouse individually based on reaching evident tumour volume of 100 mm3). Of note, groups in survival analysis were unequal due to poor engraftment success of PANC1 cells (n = 4 versus n = 7).
OS, overall survival; PANC1, gemcitabine-sensitive cell line; PANC1R, gemcitabine-resistant PANC1 cell line.

