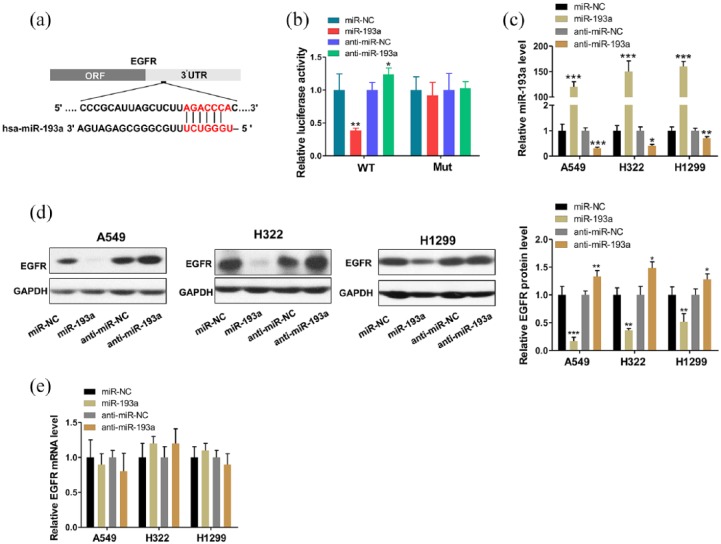
Figure 3.
MiR-193a directly regulated epidermal growth factor receptor (EGFR) expression at the post-transcriptional level. (a) Schematic depicting the binding site for miR-193a in the 3′-untranslated region (UTR) of the EGFR mRNA. (b) The relative luciferase activities in 293T cells transfected with wild type or mutant EGFR 3′-UTR. (c) Quantitative reverse transcriptase-PCR (RT-PCR) analysis of miR-193a levels in A549, H322, and H1299 cells transfected with control mimic (miR-NC), miR-193a mimic (miR-193a), control inhibitor (anti-miR-NC), or miR-193a inhibitor (anti-miR-193a). (d)Western blot analysis of EGFR protein levels in A549, H322, and H1299 cells after transfection. (e) Quantitative RT-PCR analysis of the EGFR mRNA levels in A549, H322, and H1299 cells after transfection. *p < 0.05, **p < 0.01, ***p < 0.001.

