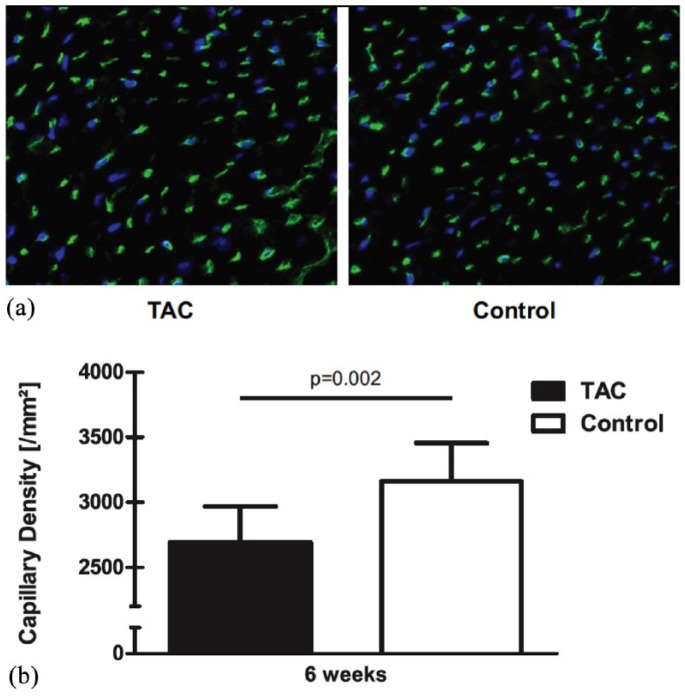
Figure 2.
Selected representative field of the left-ventricular free wall of tissue cross-sections 25 weeks after transverse aortic constriction.
(a) The image shows the visualized capillary vessels using fluorescence detection. The banded (TAC) animals showed a decreased capillary density; (b) bar graph shows quantitative analysis of capillary per mm². Capillary density was significantly decreased in myocardial tissue from TAC animals.
TAC, transverse aortic constriction.

