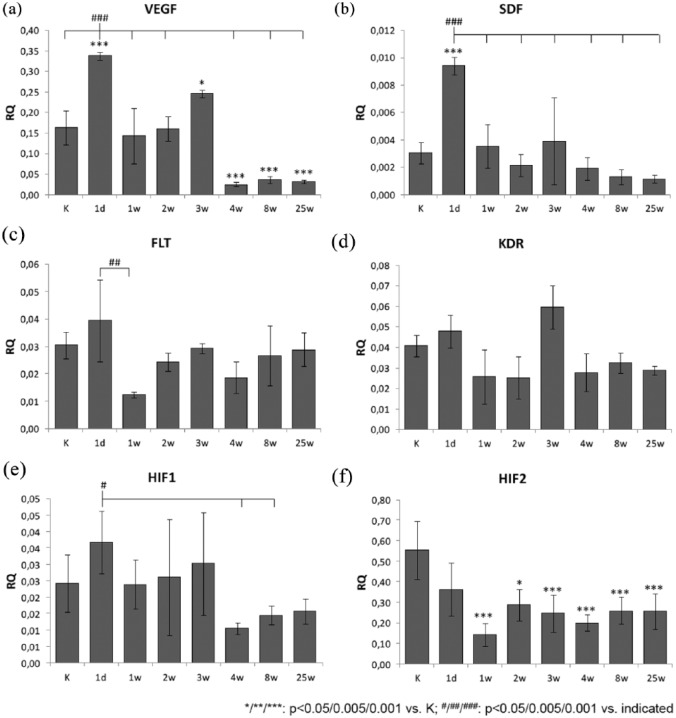
Figure 3.
Expression analysis of genes with relevance for angiogenesis in the myocardium.
The plots show the myocardial gene-expression levels of proangiogenic growth factors [(a), (b); VEGF and SDF-1], transcription factors [(c), (d); HIF-1α and HIF-2 α] and VEGF-receptors [(e), (f); FLT-1/FLT-1 and KDR/KDR] of animals who underwent transverse aortic constriction (TAC) compared with sham-operated animals (K) determined by quantitative polymerase chain reaction 1 day, 1 week, 2 weeks, 3 weeks, 4 weeks, 8 weeks and 25 weeks postoperatively. The graphs (a), (c) and (e) demonstrate the relative expression (RQ) of the target gene compared with the endogenous control (β-actin) and the statistical evaluation of the differences between each group (at each time n = 5; analysis of variance with Bonferroni post hoc test for multiple comparisons). The graphs (b), (d) and (f) show the relative gene expression compared with the sham-operated control group. Demonstrating the expression of the target gene in TAC animals in comparison with the sham animals over a 3-week observation period, the expression level of the TAC group normalized to the expression level of the sham group (RQ = 1).
*p < 0.05.
**p < 0. 005.
***p < 0.001.
#p < 0.05.
##p < 0.005.
###p < 0.001.

