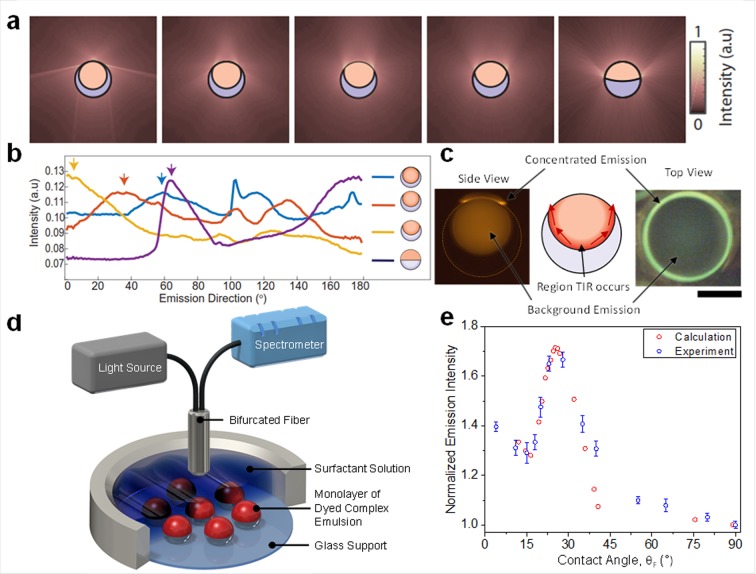
Figure 2.
Directional light emission from complex emulsions. (a) Intensity distribution around the droplet determined by 2D raytracing for varying droplet morphologies. (b) Computationally determined emission intensity in the far field as a function of polar angle measured from the droplets’ symmetry axis by full 3D raytracing. Arrows indicate the TIR light out-coupled at the three-phase junction. (c) Side-view diagram showing region of TIR (middle) and top- and side-view fluorescence optical micrographs of an emissive emulsion (scale bar, 50 μm) in state where the TIR light is directed sideways (left) and upward (right) showing the higher light intensity near the three-phase contact line. (d) Experiment for the measurement of the emission intensity as a function of droplet morphology, including a bifurcated fiber used for both excitation (λ= 400 nm) and collection of emitted light intensity (λ= 475 nm). (e) Light-curve: Calculated and measured emission intensities as a function of the contact angle at the three-phase junction above a gravity-aligned droplet monolayer, wherein the emission intensity of droplets in the Janus configuration (contact angle = 90°) was normalized to 1.0.

