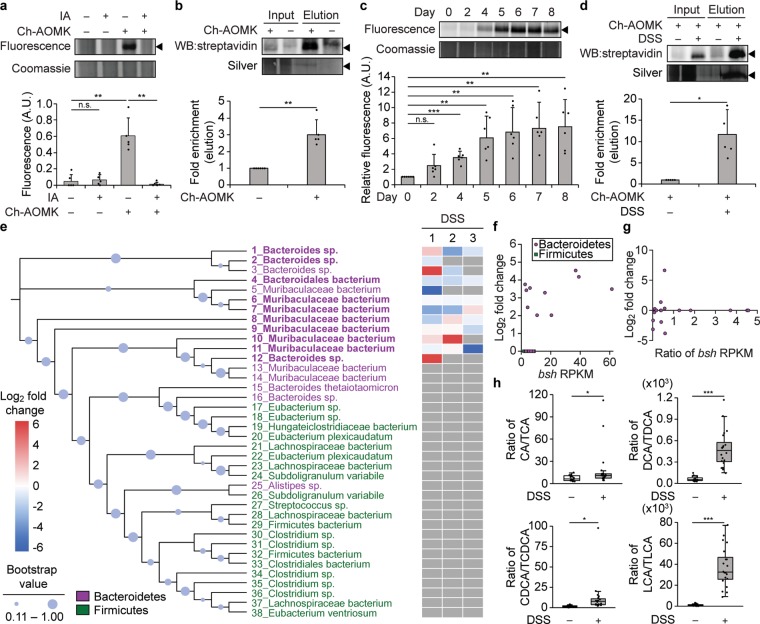
Figure 5.
Changes in BSH activity in the gut microbiome are identified using Ch-AOMK in healthy and colitic mice. (a) Bacterial lysates (100 μg) isolated from healthy mouse gut microbiomes were incubated with Ch-AOMK (100 μM) at 37 °C for 24 h. After CuAAC tagging with Fluor 488-alkyne, samples were analyzed by SDS-PAGE, followed by visualization using fluorescence. As a negative control for cysteine labeling, iodoacetamide (IA, 20 mM) was added prior to Ch-AOMK. Coomassie staining served as the loading control. Alternatively, (b) lysates (2.5 mg) were incubated with Ch-AOMK (100 μM) at 37 °C for 12 h. After CuAAC tagging with biotin-alkyne, labeled proteins were enriched by streptavidin-agarose pull-down and analyzed either by Western blot with streptavidin-HRP or by silver staining. Input is 2% of the elution. (c–e, g, h) Mice were treated with dextran sodium sulfate (DSS, 3% w/v, ad libitum) for 8 days, and (c, d) bacterial populations from the gut microbiome were lysed and analyzed as in parts a and b. The arrowhead indicates the expected mass of BSHs (35 kDa). The bands were quantified by densitometry using ImageJ (a–d, bottom panels). A.U. = arbitrary unit. (e) Phylogenetic tree of BSHs identified within the mouse metagenomic assemblies. Bootstrap confidence levels reflect 100 phylogenetic tree reconstructions and are indicated by the blue circles. Green indicates Firmicutes, magenta indicates Bacteroidetes, and bold indicates active BSHs identified by chemoproteomics using Ch-AOMK labeling, followed by CuAAC-based tagging, enrichment, and protein identification by mass spectrometry (MS)-based proteomics, using a 2-fold enrichment cutoff (see also Table S2). The heatmap corresponds to samples from three independent experiments (1–3) from mice treated with DSS, which were also analyzed by MS-based proteomics to identify changes in BSH activity during disease (see also Table S5). Red indicates higher BSH activity in DSS compared to control mice, blue indicates lower BSH activity in DSS compared to control mice (fold change according to heatmap), and gray indicates that the BSH was not identified in the indicated mass spectrometry experiment. (f) Fold change (log2) of enrichment of BSH from healthy mouse microbiomes comparing Ch-AOMK treatment to no Ch-AOMK treatment (y-axis) versus bsh gene abundance using reads per kilobase million (RPKM) in the mice (x-axis). (g) Fold change (log2) of enrichment of BSH from microbiomes of mice treated with DSS compared to vehicle controls (y-axis) versus ratio of bsh gene abundance (RPKM) in mice treated with DSS compared to controls (x-axis). The data in part g correspond to experiment 2 in part e. (h) Quantification by MS-based metabolomics of fecal bile acid levels in DSS colitis versus control mice. CA, cholic acid; TCA, taurocholic acid; DCA, deoxycholic acid; TDCA, taurodeoxycholic acid; CDCA, chenodeoxycholic acid; TCDCA, taurochenodeoxycholic acid; LCA, lithocholic acid; TLCA, taurolithocholic acid. Each plot indicates the ratio of a corresponding unconjugated to conjugated BA pair. Error bars represent standard deviation from the mean. Interquartile ranges (IQRs, boxes), median values (line within box), whiskers (lowest and highest values within 1.5 times IQR from the first and third quartiles), and outliers beyond whiskers (dots) are indicated. * p < 0.05, ** p < 0.01, *** p < 0.001, n.s. = not significant, n = (a) 5, (b) 6, (c) 6, (d) 5, (e) 3, (h) 20.

