Figure 3.
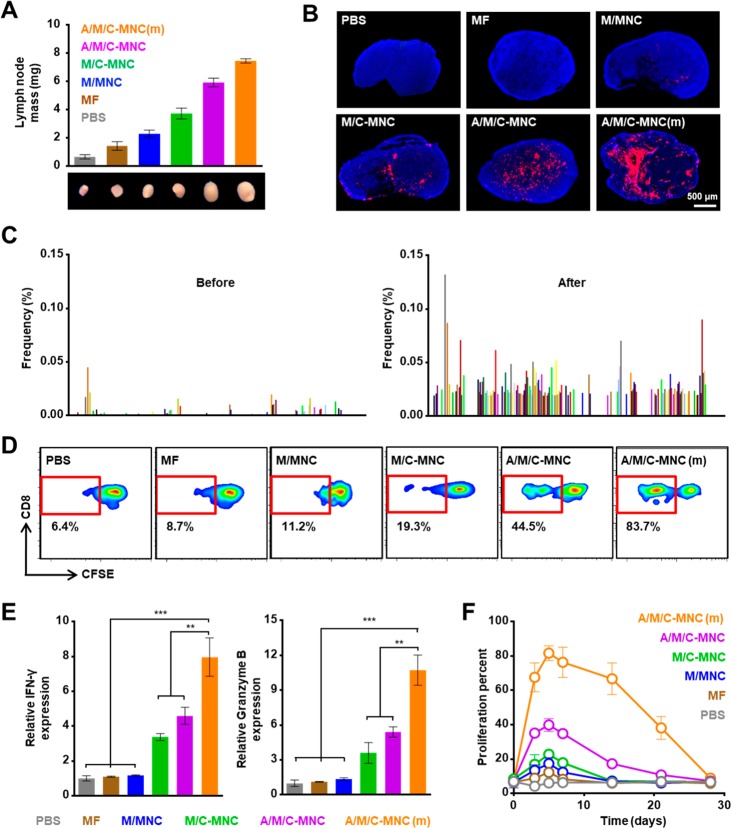
CTL proliferation in the lymph nodes in vivo. (A) Weight and size of the lymph nodes after vaccination with different formulations. (B) Immunohistochemical analysis of Ki67 expression. The nuclei were counterstained with DAPI (blue), and the Ki67 was labeled with fluorescent secondary antibody (red). (C) Frequencies of 200 representative CDR3 sequences in the lymph nodes before (left) and after (right) vaccination. (D) CFSE-based flow cytometry of CD8+ T cell proliferation in vivo after different treatments. (E) Normalized expression of intracellular IFN-γ and granzyme B in CD8+ T cells after vaccination with different formulations. (F) CTL proliferation percent 4 weeks after vaccination with different formulations. All data represent the mean ± SD (n = 3).

