
Figure 7.
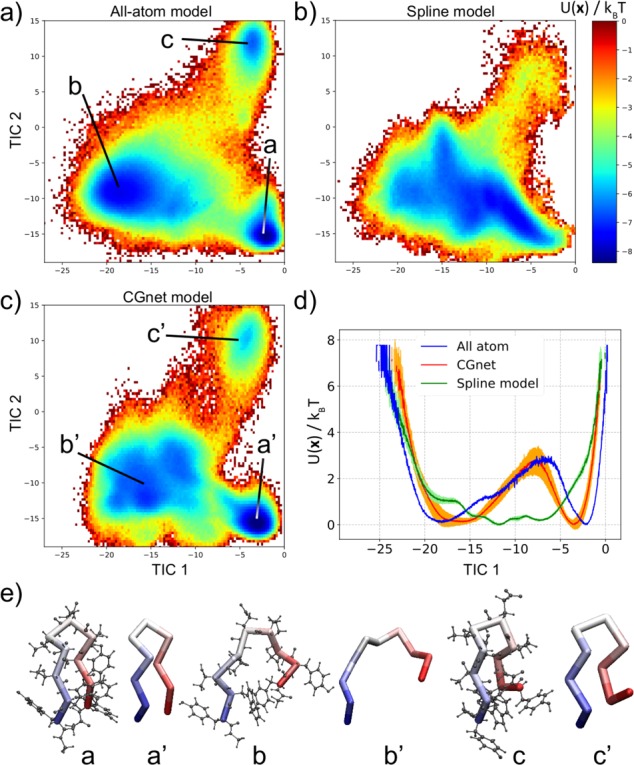
Free energy landscape of Chignolin for the different models. (a) Free energy as obtained from all-atom simulation, as a function of the first two TICA coordinates. (b) Free energy as obtained from the spline model, as a function of the same two coordinates used in the all-atom model. (c) Free energy as obtained from CGnet, as a function of the same two coordinates. (d) Comparison of the one-dimensional free energy as a function of the first TICA coordinate (corresponding to the folding/unfolding transition) for the three models: all-atom (blue), spline (green), and CGnet (red). (e) Representative Chignolin configurations in the three minima from (a–c) all-atom simulation and (a′–c′) CGnet.