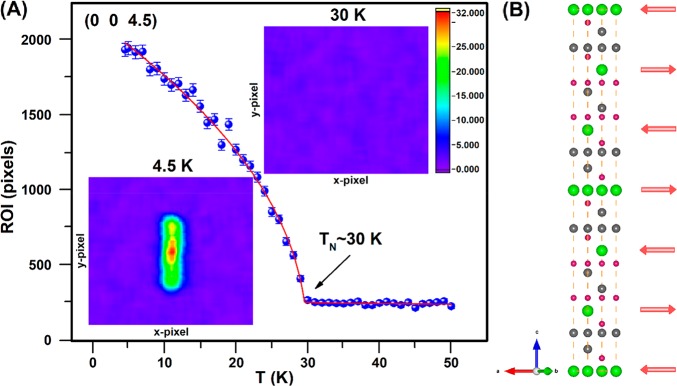
Figure 4.
Magnetic structure of EuSn2P2. (A) (main panel) Temperature-dependence of the magnetic scattering. The pixel number is for the selected region of interest (enclosed in the purple rectangle insets). The data indicate that TN ∼ 30 K, resulting from the fit of the red curves to the data. (insets, top right) Magnetic signal intensity map at 30.0 K for the reciprocal lattice plane (0 0 4.5). (insets, bottom left) Magnetic signal intensity map at 4.5 K for the reciprocal lattice plane (0 0 4.5). (B) Magnetic unit cell of EuSn2P2. The red arrows indicate the orientation of magnetic moments for each layer of Eu atoms.

