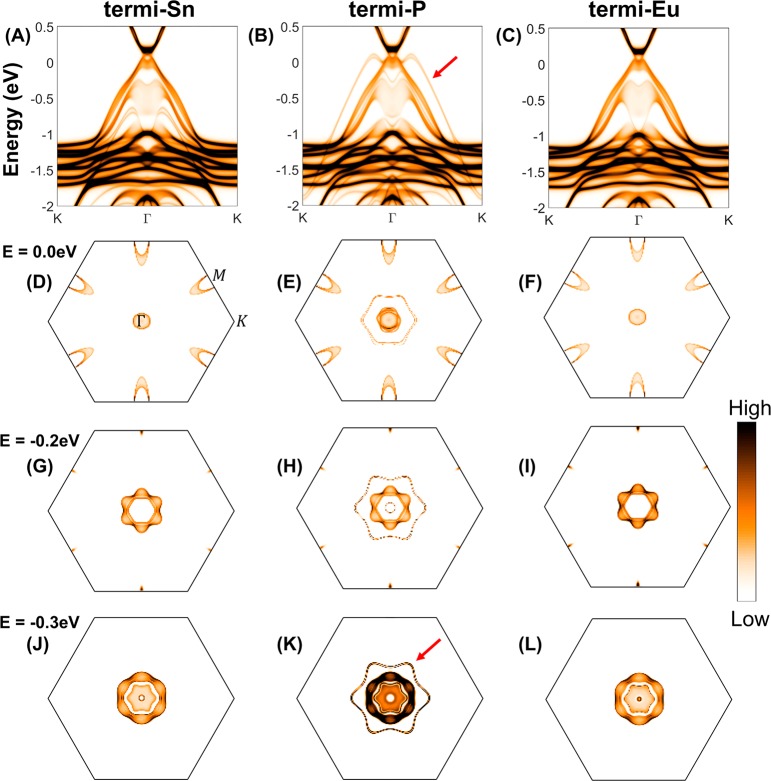
Figure 9.
Calculated surface Fermi surfaces of EuSn2P2. For the (001) surface (the cleavage plane), terminated by (A–C) an Eu layer, (D–F) a P layer, or (G, H) a Sn layer. The calculated iso-energy band contours are shown for E = 0 (the calculated Fermi Energy), −0.2, and −0.3 eV for Green’s function surface spectral weight simulation. The depth of the color indicates the weight of the charge density of each state at the surface layer. The surface states clearly appear as the extra ringlike Fermi surfaces in the panels.

