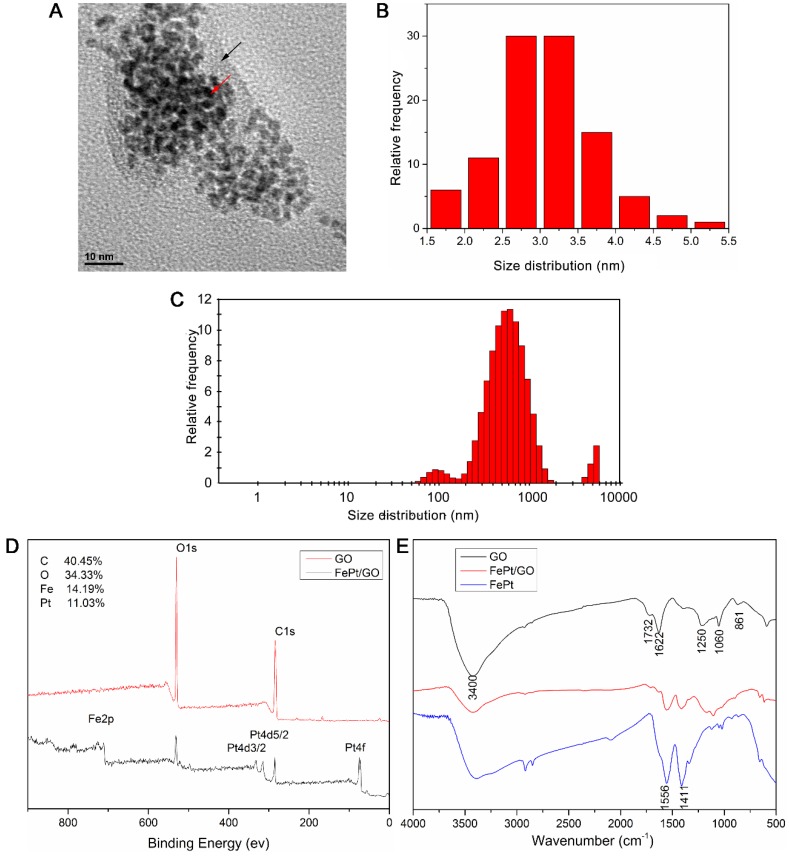
Figure 1.
Characterization of FePt/GO NSs. (A) Representative TEM image of FePt/GO NSs. Black arrow indicates GO, and red arrow indicates FePt NPs. (B) The average diameter of FePt nanoparticles was 3.05 nm. (C) The size distribution of FePt/GO NSs, whose mean diameter was 542.06 nm. (D) The XPS spectrum of FePt/GO NSs, and the relatively atomic content of C, O, Fe, Pt were 40.45%, 34.33%, 14.19% and 11.03% respectively. (E) The FTIR spectrum of GO, FePt NPs and FePt/GO NSs.

