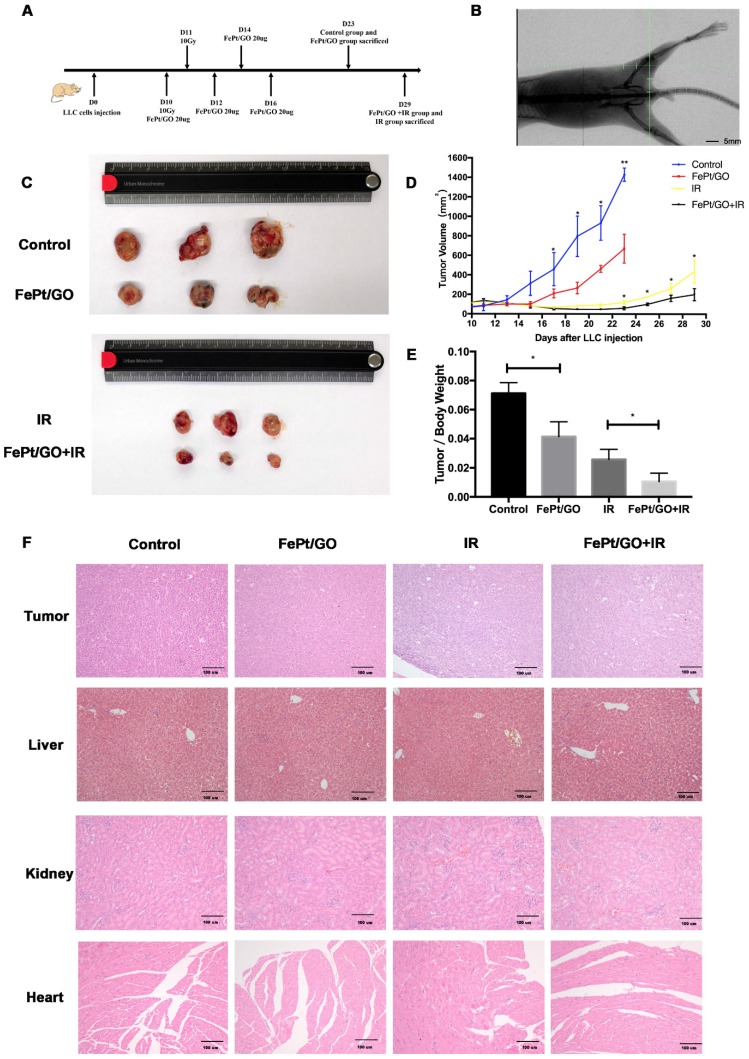
Figure 6.
FePt/GO NSs increased radiation sensitivity in vivo. (A) Treatment scheme of animal study. (B) Representative image of X-rays fluoroscopy before irradiation, scale bar: 5 mm. (C) Gross view of tumor. (D) Growth curve of tumor volume. N = 3; *, p < 0.05. (E) Tumor/Body weight ratio. N = 3; *, p < 0.05. (F) Representative panels of HE staining of tumor, liver, kidney and heart of mice, scale bar: 5 mm.

