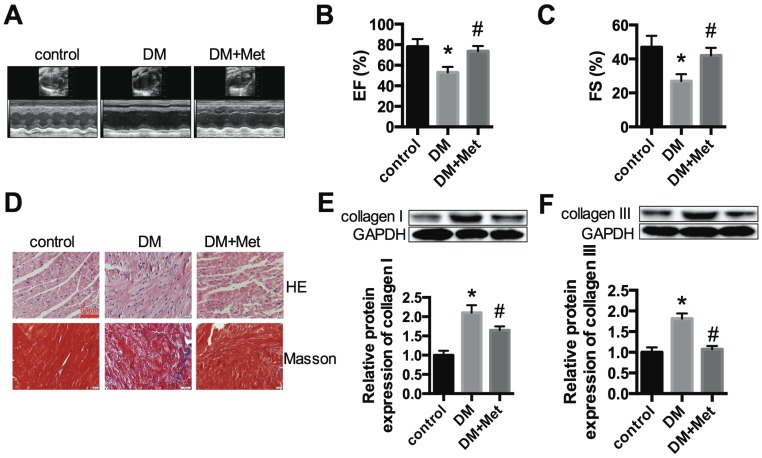
Figure 1.
Cardiac function and morphology in diabetic mice treated with or without metformin. (A) M-mode echocardiograms of the left ventricles are shown. EF (B) and FS values (C) are shown. (D) The results of HE and Masson's trichrome staining are shown. Scale bar, 60 μm. (E and F) Western blot analysis of collagen I and collagen III expression in the different groups. *P<0.05 compared to the control group, #P<0.05 compared to the DM group. n=5.

