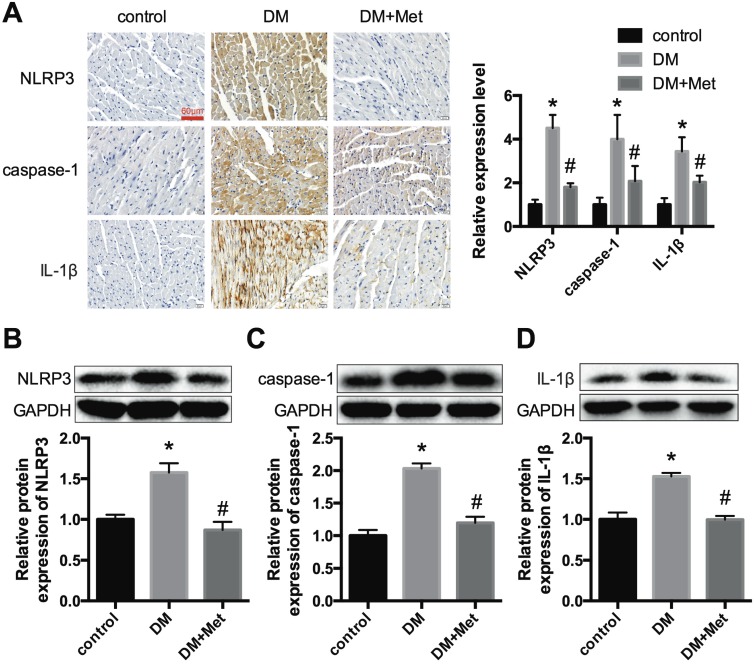
Figure 2.
NLRP3, caspase-1 and IL-1β expression levels in vivo. (A) Immunohistochemistry analysis was performed to detect the expression of NLRP3, caspase-1 and IL-1β. Scale bar, 60 μm. The results were quantified and statistically analyzed. Western blotting analyses were conducted to detect the expression levels of NLRP3 (B), caspase-1 (C) and IL-1β (D). *P<0.05 compared to the control group, #P<0.05 compared to the DM group. n=5.

