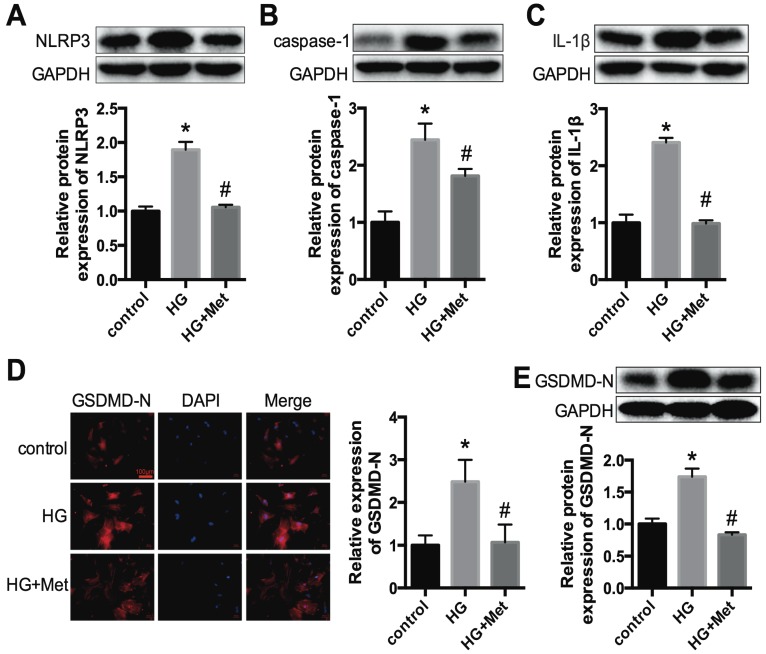
Figure 3.
NLRP3, caspase-1, IL-1β and GSDMD-N expression levels in vitro. Primary cardiomyocytes were treated with 5.5 mmol/L (control) and 30 mmol/L glucose (HG). The cardiomyocytes in the HG group were treated with or without 2 mM metformin. Western blotting was used to detect the expression levels of NLRP3 (A), caspase-1 (B) and IL-1β (C). The expression levels of GSDMD-N were detected by an immunofluorescence assay (D) and western blotting (E). Scale bar, 100 μm. *P<0.05 compared with the control group, #P<0.05 compared to the HG group. n=3.

