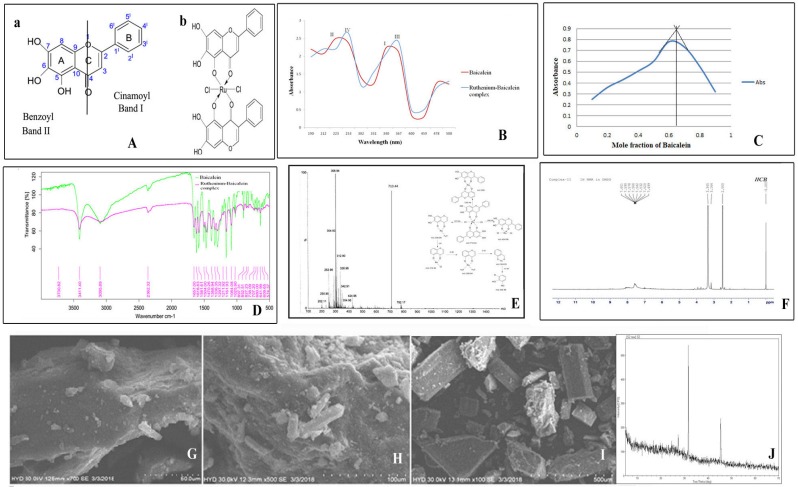
Figure 1.
(A) Structure of the flavonoid and the complex (a) Basic structure of the flavonoid baicalein (b) Structure of the ruthenium baicalein complex. (B) UV-Visible spectra of baicalein and ruthenium- baicalein complex. (C) Plot of absorbance vs mole fraction of baicalein at 367 nm. (Continuous Variation Method). (D) FTIR spectra of baicalein and ruthenium baicalein complex.(E) Mass spectroscopy of ruthenium baicalein complex showing the molecular ion peaks and the fragmentation mechanism of the complex. (F) 1H NMR spectra of ruthenium baicalein complex. Scanning electron microscopy (SEM) of the complex at (G) 400X, (H) 250X and (I) 50X. (J) X-ray diffract grams of ruthenium baicalein complex.

