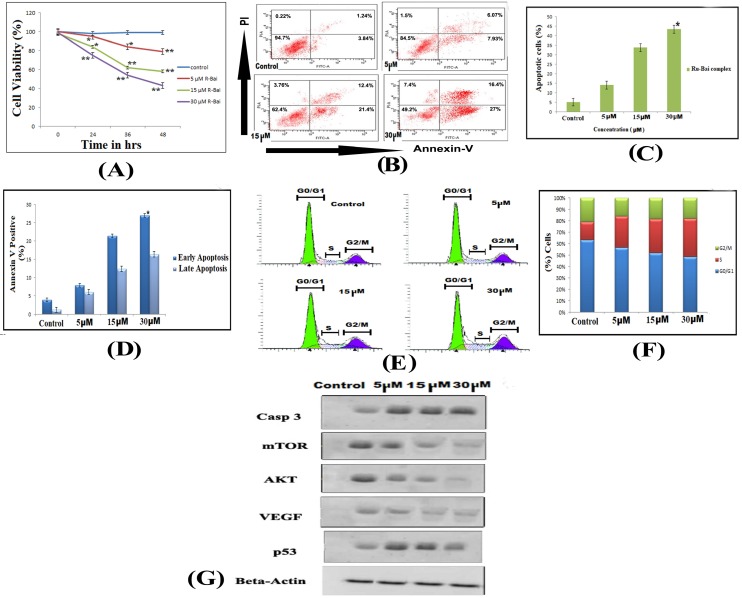
Figure 3.
(A) Effects of ruthenium baicalein complex on HT-29 cell viability. Ruthenium baicalein complex at three different concentrations (5, 15 and 30 µM) were compared against the control at different time intervals. The complex at 15 and 30 µM exhibited significant difference (**p<0.01 and *p<0.05) against the control. (B) Detection of apoptosis in HT-29 cells by Flow cytometry. In a double labelled system, the unfixed HT-29 cells, both ruthenium baicalein (5, 15 and 30 µM) treated and control were stained with PI and Annexin-V and analysed by flow cytometer. Dual parameter dot plot of Annexin-V (x axis) and PI (y axis) were shown. Quadrants: lower left (LL) - live cells, lower right (LR) - early apoptotic cells, upper right (UR) - late apoptotic cells, upper left (UL) - necrotic cells. (C) Percentage of apoptotic cells versus concentration. Three independent experiments were performed, *P < 0.01, significant difference between ruthenium baicalein complex (5, 15 and 30 µM) and control. (D) Percentage of Annexin-V positive cells. Three independent experiments were performed. *P < 0.01, significant difference between ruthenium baicalein complex (5, 15 and 30 µM) and control. (E) Analysis of cell cycle phase distribution of HT-29 cells after the treatment with ruthenium baicalein complex (5, 15 and 30 µM) for 48 h by single label flowcytometry. The cells were fixed and DNA was labeled with PI. The histogram data represents the DNA content (x axis) versus cell number (y axis). Data is representative of three different experiments. (F) Quantitative of distribution of percentage of HT-29 cells in different phases of cell cycle. (G) Western blot analysis of expressions of p53, caspase-3, Akt, VEGF, and mTOR in HT-29 cells after treatment with ruthenium baicalein complex (5, 15 and 30 µM). Data is representative of three different experiments.

