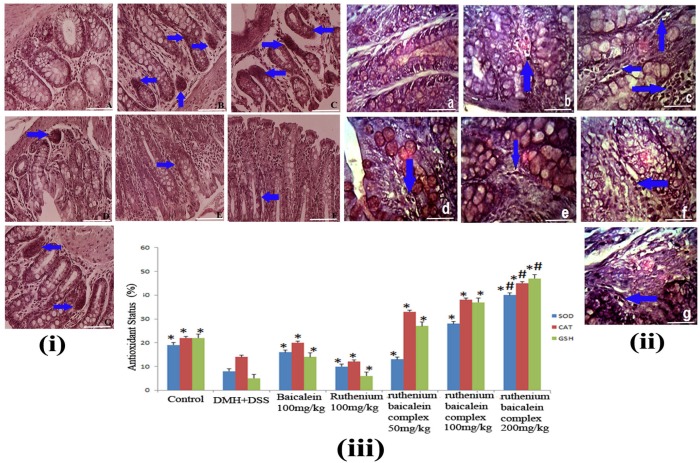
Figure 6.
(i) The immunohistochemical analysis of expression of PCNA of different group of rats at 40X magnification. (A) the normal control group showing normal PCNA expression; (B) the DMH and DSS treated group showing strong expression of PCNA; (C) the ruthenium baicalein complex treated with 200 mg/kg of complex showing significant reduction in PCNA expression; (D) and (E) are the ruthenium baicalein of doses 100 and 50 mg/kg treated groups showing mild PCNA expression, respectively; (F) the ruthenium; and (G) the baicalein treated groups showing moderate PCNA expression. Approximately, 200 cells were counted per field, 10 fields were examined per slide. Ten slides were examined per group. (ii) The immunohistochemistry of TUNEL apoptotic cells at 40Xmagnification. (a) The normal control group showing normal apoptosis; (b) the DMH and DSS treated group showing weak apoptosis; (c)the ruthenium baicalein complex treated with 200 mg/kg of complex showing significant increase in apoptosis; (d) and (e) are the ruthenium baicalein of doses 100 and 50 mg/kg treated groups showing moderate apoptosis, respectively; (f) the ruthenium; and (g) the baicalein treated groups showing weak apoptosis. Approximately 700 cells were counted per field, 10 fields were examined per slide and 10 slides were examined per group.

