Figure 2.
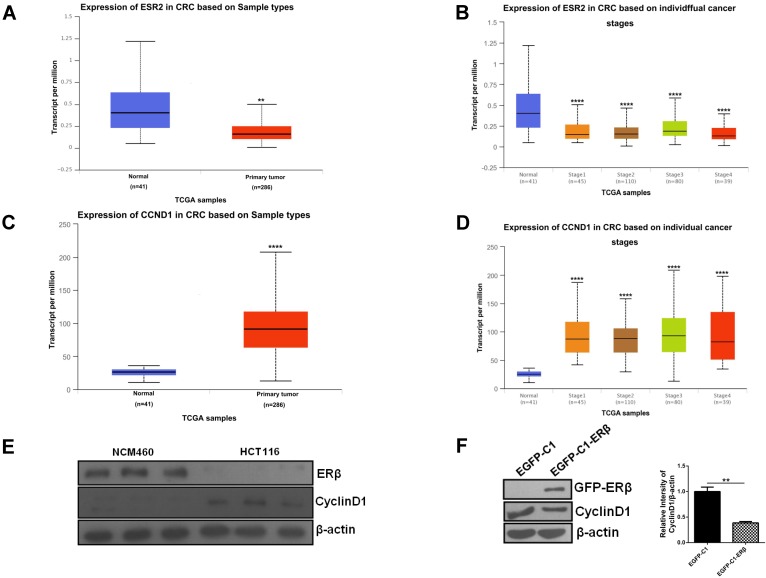
Downregulated Cyclin D1 contributes to ERβ-induced anti-proliferation in HCT116 cells. (A) Boxplot showing relative expression of ESR2 in TCGA samples (normal vs primary tumor). (B) Boxplot showing relative expression of ESR2 in TCGA samples. (normal vs stage 1-4 colorectal cancer patients). (C) Boxplot showing relative expression of CCND1 in TCGA samples (normal vs primary tumor). (D) Boxplot showing relative expression of CCND1 in TCGA samples. (normal vs stage 1-4 colorectal cancer patients). (E) Western blot analysis of ERβ and CyclinD1 expression in NCM460 and HCT116. (F) Cells were treated as described in (Fig. 1), then CyclinD1 was tested by immunoblotting. Bar graph (right) shows the relative ratio of CyclinD1 to β-actin in HCT116. Western blot was quantified using ImageJ software. Data shown are mean ± S.D. of three independent experiments. (*, P<0.05; **, P <0.01; ***, P<0.001; ****, P<0.0001).

