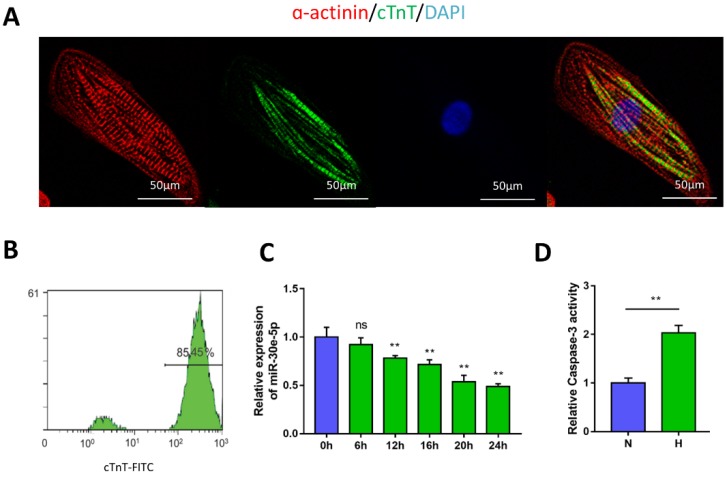
Figure 1.
Characterization of hiPSC-CMs and hypoxia-induced downregulation of miR-30e-5p. (A) Immunostaining of hiPSC-CMs after 30 days of differentiation and culture: α-actinin (red), cTnT (green), DAPI (blue). (B) Representative flow cytometry result showing the efficiency of hiPSC-CM differentiation. (C) Dynamic changes in miR-30e-5p expression determined by RT-qPCR in hiPSC-CMs treated with hypoxia. (D) Measurement of hiPSC-CM viability using Caspase-3 activity assay after the indicated treatments. All the data are expressed as the means ± S.E.M. Statistically significant differences between individual groups (n≥3; *P<0.05, **P<0.01, and ***P<0.001. Scale bar: 50µm).

