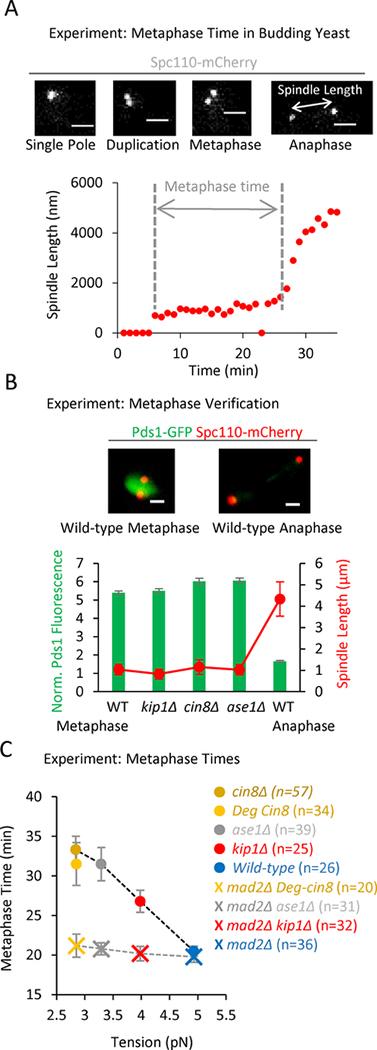
Figure 3: A decreasing gradient in tension leads to an increasing gradient in metaphase times.
(A) Top: Representative images of budding yeast Spc110-mCherry spindle pole markers taken from a time lapse series of a cell going through mitosis (scale bars, 1500 nm). Bottom: Plot of spindle length vs time. Recorded metaphase time shown in grey. (B) Top: Representative images of Pds1-GFP fluorescence in budding yeast cells at metaphase (left) and anaphase (right) (scale bars, 1500 nm). Bottom: Quantification of Pds1-GFP intensity at metaphase-like spindle lengths in wild type and mutant cells. This plot suggests that the spindle lengths designated as metaphase in the spindle length vs time experiments were indeed in metaphase, since Pds1-GFP fluorescence was still present in high levels. (C) Average metaphase time vs tension for the wild-type and tension mutant cells (circles; F4,187 = 7.77, p<0.0001, linear trend p <0.0001), and metaphase time for the wild-type and tension mutant cells when Mad2 was additionally knocked out (crosses, corresponds to the detachment data in Fig. S3C). Metaphase times remain near wild-type levels for all mutants in the absence of Mad2 (F3,126 = 0.45, p=0.72), despite reduced tension and increased incidence of detachments (Fig. S3C). All panels: error bars=SEM.

