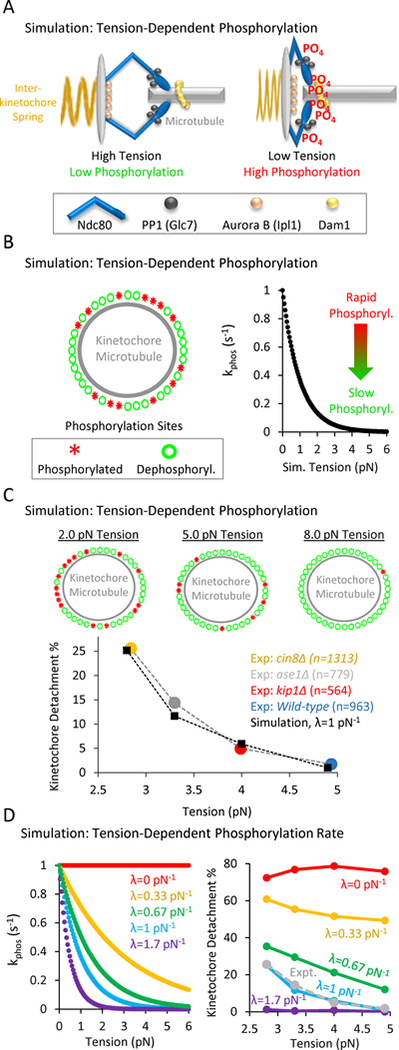
Figure 4: In computational simulations, a tension-dependent phosphorylation rate can explain tension-dependent detachment gradient.
(A) Speculative cartoon showing the architecture of a budding yeast kinetochore under high tension (left) and low tension (right). (B) The simulation tests whether a tension-dependent phosphorylation rate constant can explain our experimentally observed gradient in detachment rates. Left: Schematic of simulation: each kinetochore has Nsites = 50 phosphorylation sites, which can stochastically switch between a phosphorylated state (red asterisks) and a dephosphorylated state (green circles). Right: The phosphorylation rate constant in the simulation is exponentially sensitive to tension (Eqn. 1), such that rapid phosphorylation occurs when tension is high, and slower phosphorylation occurs when tension is low. (C) Top: Representative images of the relationship between tension and the number of phosphorylated kinetochore sites in the simulation. Low tension leads to an increased number of phosphorylated sites on the kinetochore (left), while higher tension decreases the number of phosphorylated sites on the kinetochore (right) (see also Movie S1). Bottom: Plots showing the dependence of detachment rate on tension, as was experimentally observed (colored circles) and as predicted by simulation (black diamonds). The simulation can explain the observed gradient in detachment by using a tension-dependent phosphorylation rate as shown in Fig. 4B, right and Eqn. 1. (D) Left: λ was the scaling factor that determined the influence of tension on the phosphorylation rate constant (pN−1) in Eqn. 1, such that for λ=0, there was no influence of tension on the phosphorylation rate constant (red), and for λ>0, increased tension would act to exponentially decrease the phosphorylation rate constant per Eqn. 1. Right: The best fit between experiment and simulation was for λ=1 pN−1 (light blue, experimental data shown as dotted grey line).

