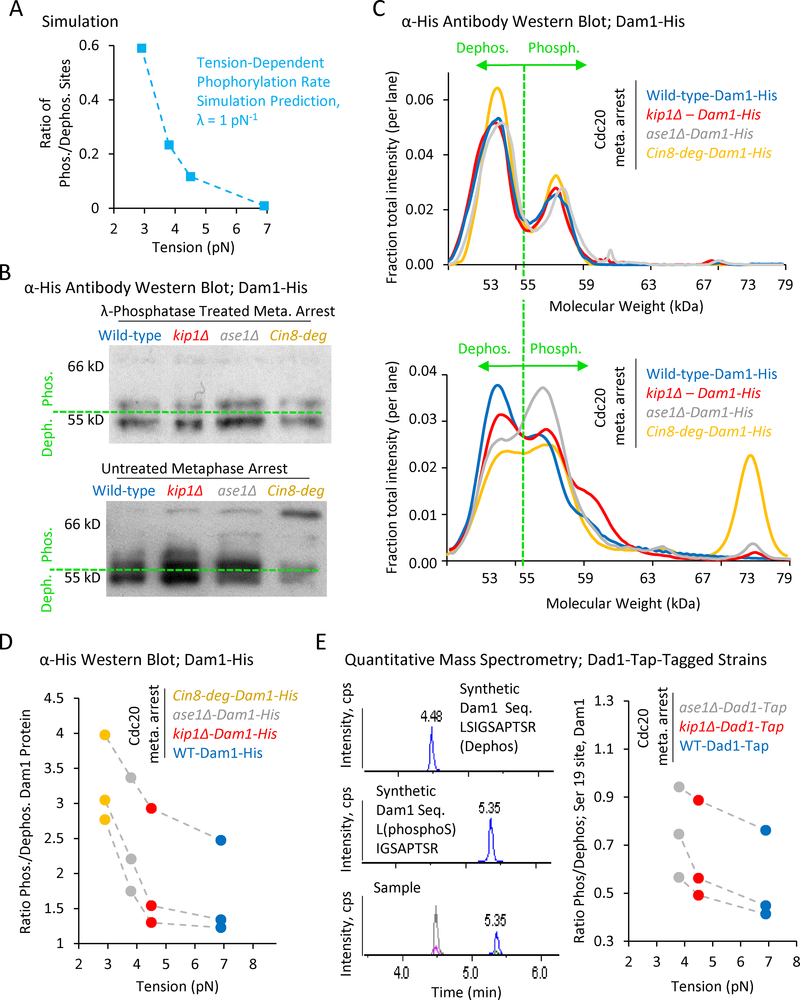
Figure 5: A decreasing gradient in tension leads to an increasing gradient in Dam1 phosphorylation.
(A) Simulation prediction for the ratio of phosphorylated kinetochore sites vs tension. (B) Top: Anti-His western blots of Dam1-His purified from Cdc20-arrested wild-type and mutant cells, and then treated with λ-phosphatase. Bottom: Anti-His western blots of Dam1-His purified from Cdc20-arrested wild-type and mutant cells in the presence of phosphatase inhibitors. A shift towards higher molecular weights is indicative of increased phosphorylation. (C) Quantification of relative band intensities for each lane in λ-phosphatase treated samples (top), and in samples purified with phosphatase inhibitors (bottom). (D) The ratio of phosphorylated (> 55 kDa) to dephosphorylated (≤ 55 kDa) Dam1 protein as calculated from western blot band intensities demonstrates increasing phosphorylation with decreasing tension (p=0.043, single-factor ANOVA, 3 individual trials shown). (E). Left: Mass spectrometry scans of synthetic proteins (top and middle) and a typical experimental protein sample (bottom). Right: Quantitative mass spectrometry demonstrates an increasing gradient in the phosphorylation ratio at serine 19 of Dam1 with decreasing tension (3 individual trials shown, p=0.015, single-factor ANOVA, 3 groups).

