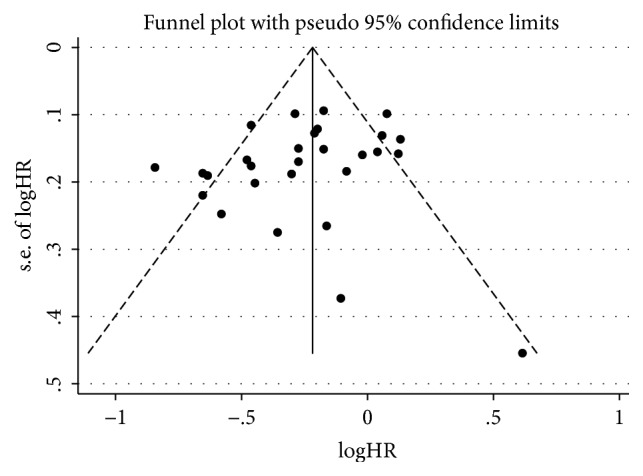
Figure 3.

The publication bias analysis. Funnel plot of overall survival from both arms in included RCTs for the visual detection of systematic publication bias and small study effect. Each circle represents treatment effect expressed as the logarithm of the hazard ratio of overall survival in each trial plotted against standard error as a measure of study size. The diamond and the vertical line represent the pooled estimate from the meta-analysis.
