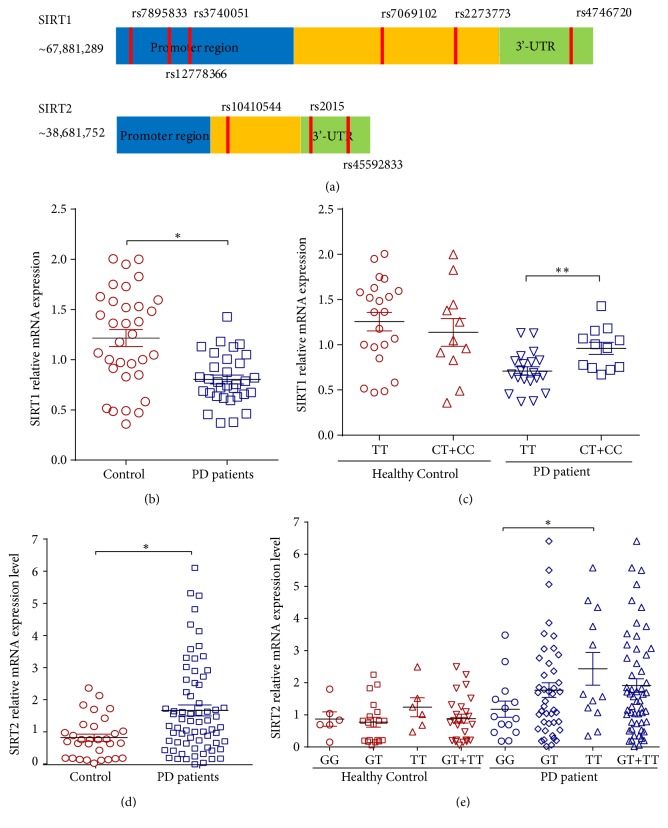
Figure 1.
The genotype distribution between the two SNPs and the expression of their corresponding sirtuins in the peripheral blood of PD patients and healthy controls. (a) The distribution area of the nine SNPs in SIRT1 and SIRT2 gene. (b) The mRNA expression level of SIRT1 distribution in the peripheral blood of the PD patient (n=33) and healthy control (n=32). (c) The mRNA expression level of SIRT1 distribution of rs12778366 C/T genotype carriers in the peripheral blood of the PD patient and healthy control. (d) The mRNA expression level of SIRT2 distribution in the peripheral blood of the PD patient (n=31) and healthy control (n=68). (e) The mRNA expression level of SIRT2 and the distribution of rs2015 G/T genotype carriers in the peripheral blood of the PD patient and healthy control. Data represent the mean ± SEM, ∗P<0.05 vs. control group, ∗∗P<0.01 vs. control group.

