
Figure 3.
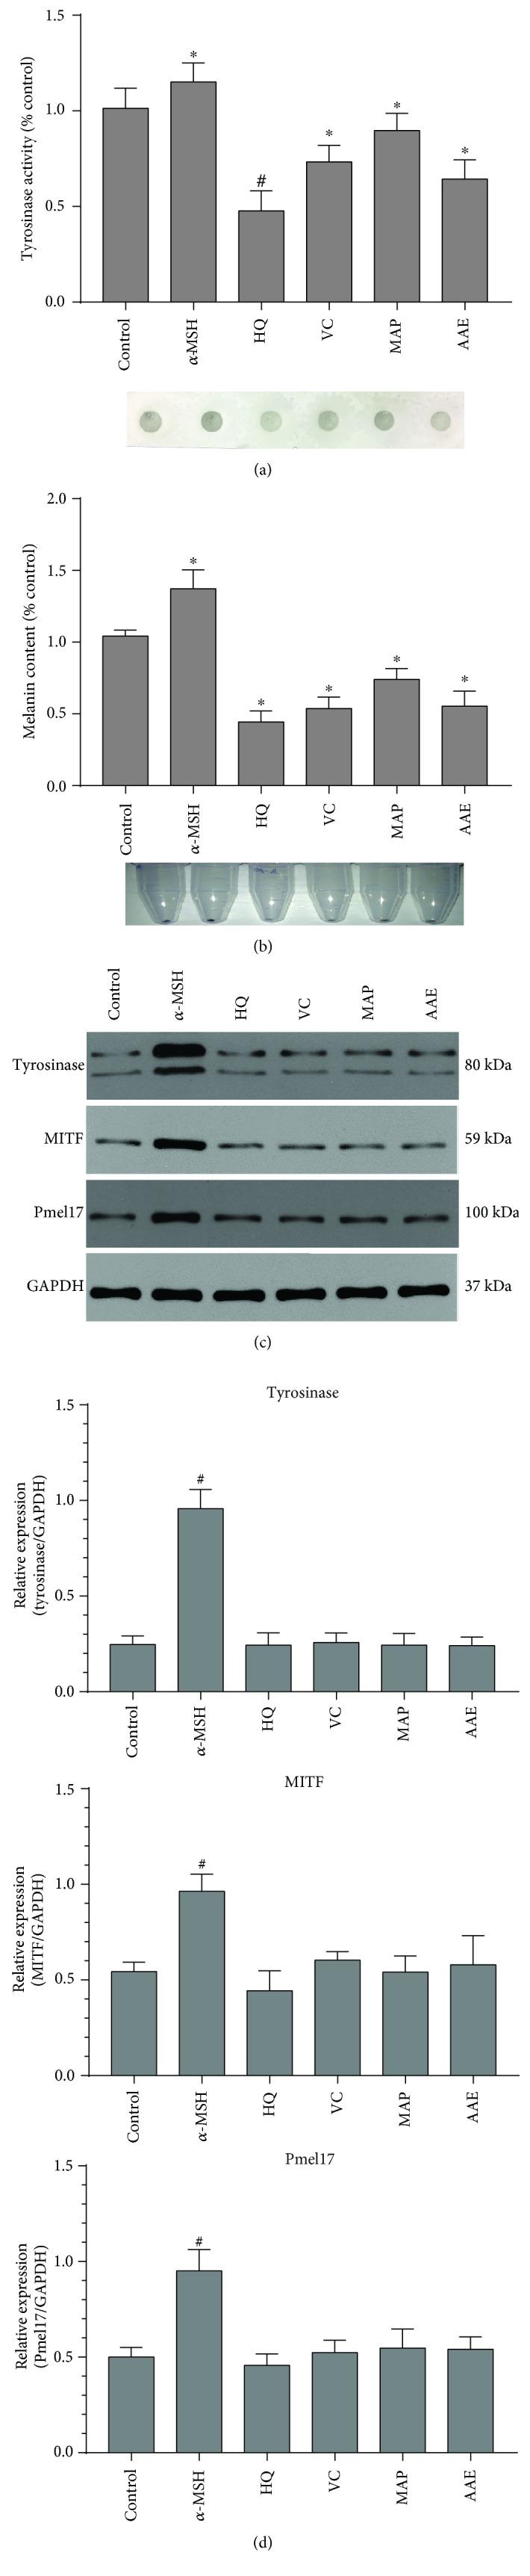
Effects of VC, MAP, or AAE on the tyrosinase activity, melanin content, and the expression level of melanogenic proteins. (a) MCs were treated with 1 mM VC, MAP, or AAE for 48 h, after which the tyrosinase activity of treated MCs was measured using the dot-blot assay as described in Materials and Methods. Results are given as the percentage compared to the control group. Representative dot images for the detection of tyrosinase activity immobilized on PVDF membranes are shown at the bottom. (b) Primary human MCs were treated with the indicated compounds for 48 h, and then, melanin content was measured using spectrophotometric analysis. Representative cell pellet images are shown at the bottom. (c) Treated or untreated human MCs were harvested, and equal amounts (10 μg per lane) of each protein extract were resolved using 10% SDS-PAGE electrophoresis. Protein loading variations were determined by immunoblotting with an anti-GAPDH antibody. Representative blots are shown. (d) Histograms showing the densitometric quantification of data with means ± SD of three independent experiments. ∗ P < 0.05, # P < 0.01, compared to the untreated control.