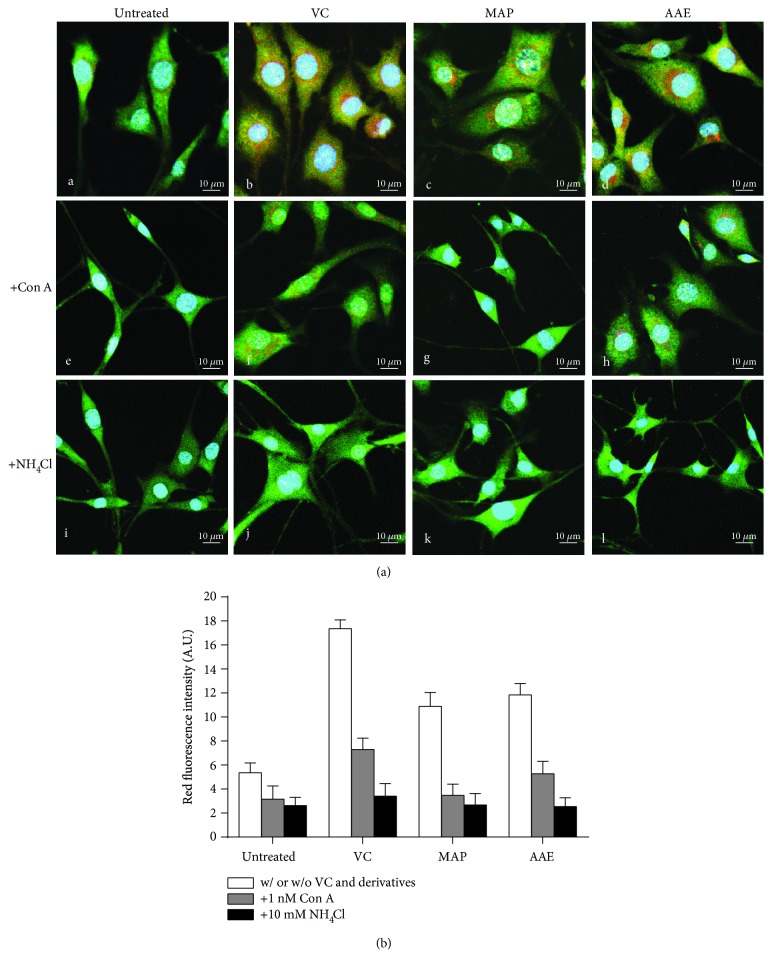
Figure 4.
Visualization of cytoplasmic acidification in treated MCs using AO fluorescent staining. (a) MCs were seeded on coverslips in a 6-well plate and then untreated (A, E, and I) or treated with VC (B, F, and J), MAP (C, G, and K), or AAE (D, H, and L) for 48 h. After treatment, the MCs were incubated with fresh medium containing 5 μg/ml AO for 30 min. The red fluorescence staining indicates the acidic cytoplasmic compartment. For pH neutralization, the MCs were simultaneously untreated (A–D) or treated with 10 nM Con A (E–H) or 10 mM NH4Cl (I–L). Nuclei were stained with DAPI (blue). Scale bar: 10 μm. (b) Red fluorescence intensity (arbitrary units (A.U.)) for AO staining was measured using ImageJ. Histogram shows the results determined on 50 cells which are presented as means ± SD for three independent experiments. ∗∗ P < 0.01 versus only VC or its derivatives.

