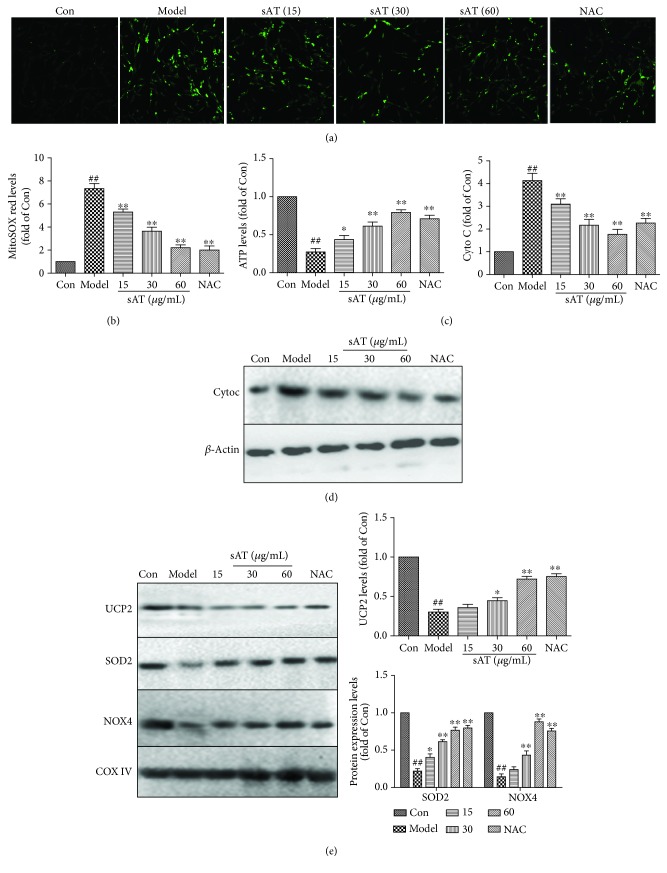
Figure 3.
Effects of sAT on mitochondrial dysfunction induced by I/R. (a) Mitochondrial transmembrane potential (MMP) was detected by Rh123 staining. Laser confocal microscopy was used to take photos (×200). (b) Mitochondrial superoxide was detected by mitoSOX red staining. (c) ATP contents in cells were detected by an ATP determination kit. The protein expression levels in the cytoplasm (d) and mitochondrial fraction (e) were detected by Western blotting. The columns and errors bars were represented as means ± SD (n = 3). ##P < 0.01 vs. the Con group. ∗P < 0.05, ∗∗P < 0.01 vs. the model group.

