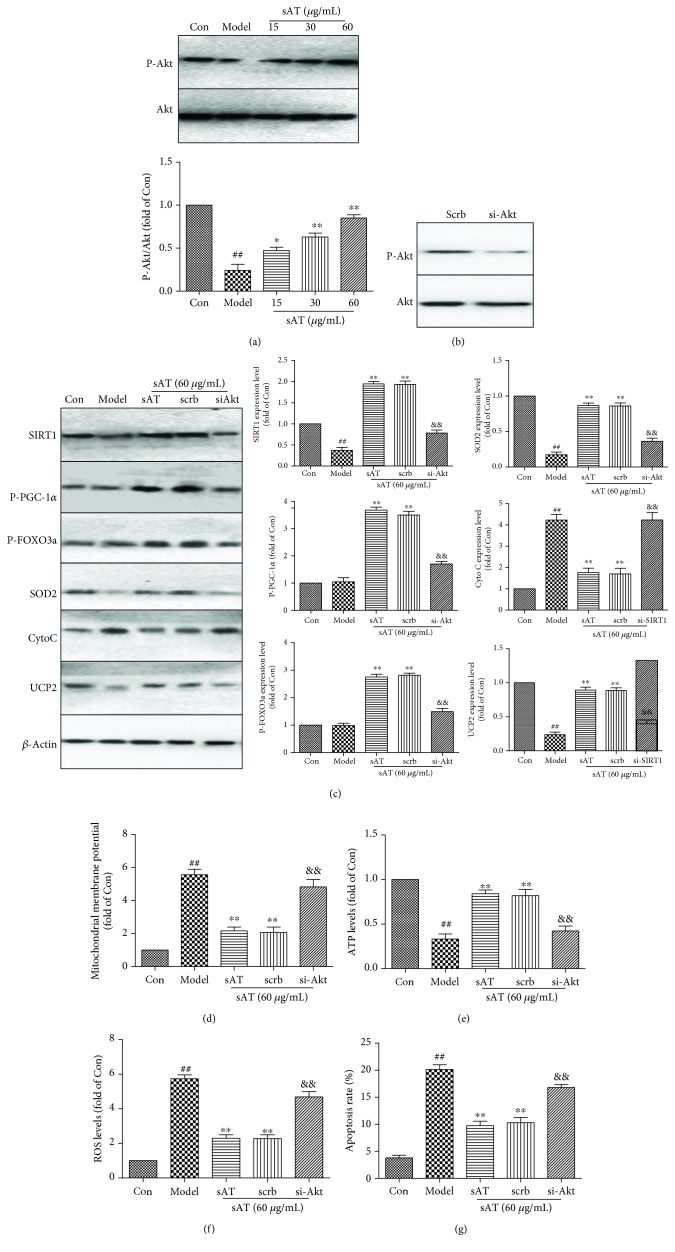
Figure 7.
sAT activated SIRT1 via activation of PI3K/AKT signaling pathways. (a) Relative levels of phosphorylated Akt in HT22 cells pretreated with sAT followed by I/R for 24 h. HT22 cells were transfected with Akt-specific siRNA (si-Akt) or control siRNA (scrb) for 48 h and treated with sAT (60 μg/mL) with or without I/R treatment. (b) Relative levels of phosphorylated Akt in HT22 cells after transfection. (c) The protein levels of SIRT1, P-PGC-1α, P-FOXO3a, Cyto C, SOD2, and UCP2 in HT22 cells after transfection. (d) Mitochondrial membrane potential was detected in cells after transfection. (e) ATP levels were measured as in the method shown in Materials and Methods. (f) ROS levels in HT22 cells after transfection. (g) Apoptosis rate in HT22 cells after transfection. The columns and error bars were represented as means ± SD (n = 3). ##P < 0.01 vs. the Con group, ∗∗P < 0.01 vs. the model group, &&P < 0.01 vs. the scrb group.

