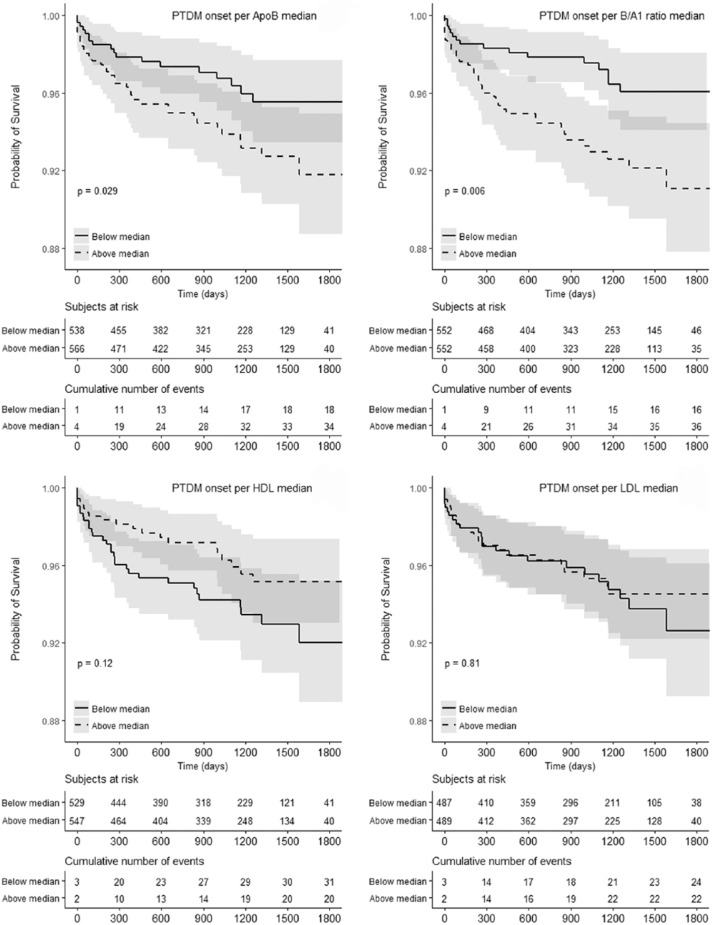
Figure 3.
Time-to-PTDM incidence for Apo B, Apo B/A1, HDL-C, and LDL-C.
Note. Kaplan-Meier PTDM-free survival curves for subjects above or below the median for each lipid parameter. Log-rank test was used to assess significance. Apo A1 is not shown (P = .23 in Cox regression). Time is represented in days. PTDM = posttransplant diabetes mellitus; Apo B = apolipoprotein B; Apo B/A1 = apolipoprotein B/A1; HDL-C = high-density lipoprotein cholesterol; LDL-C = low-density lipoprotein cholesterol; Apo A1 = apolipoprotein A1.

